Rain Gauge: GPM Precipitation Science Research Facility
Wallops PRF High-Density Gauge Network
The Wallops GPM PRF is currently supporting multiple gauge and disdrometer networks.
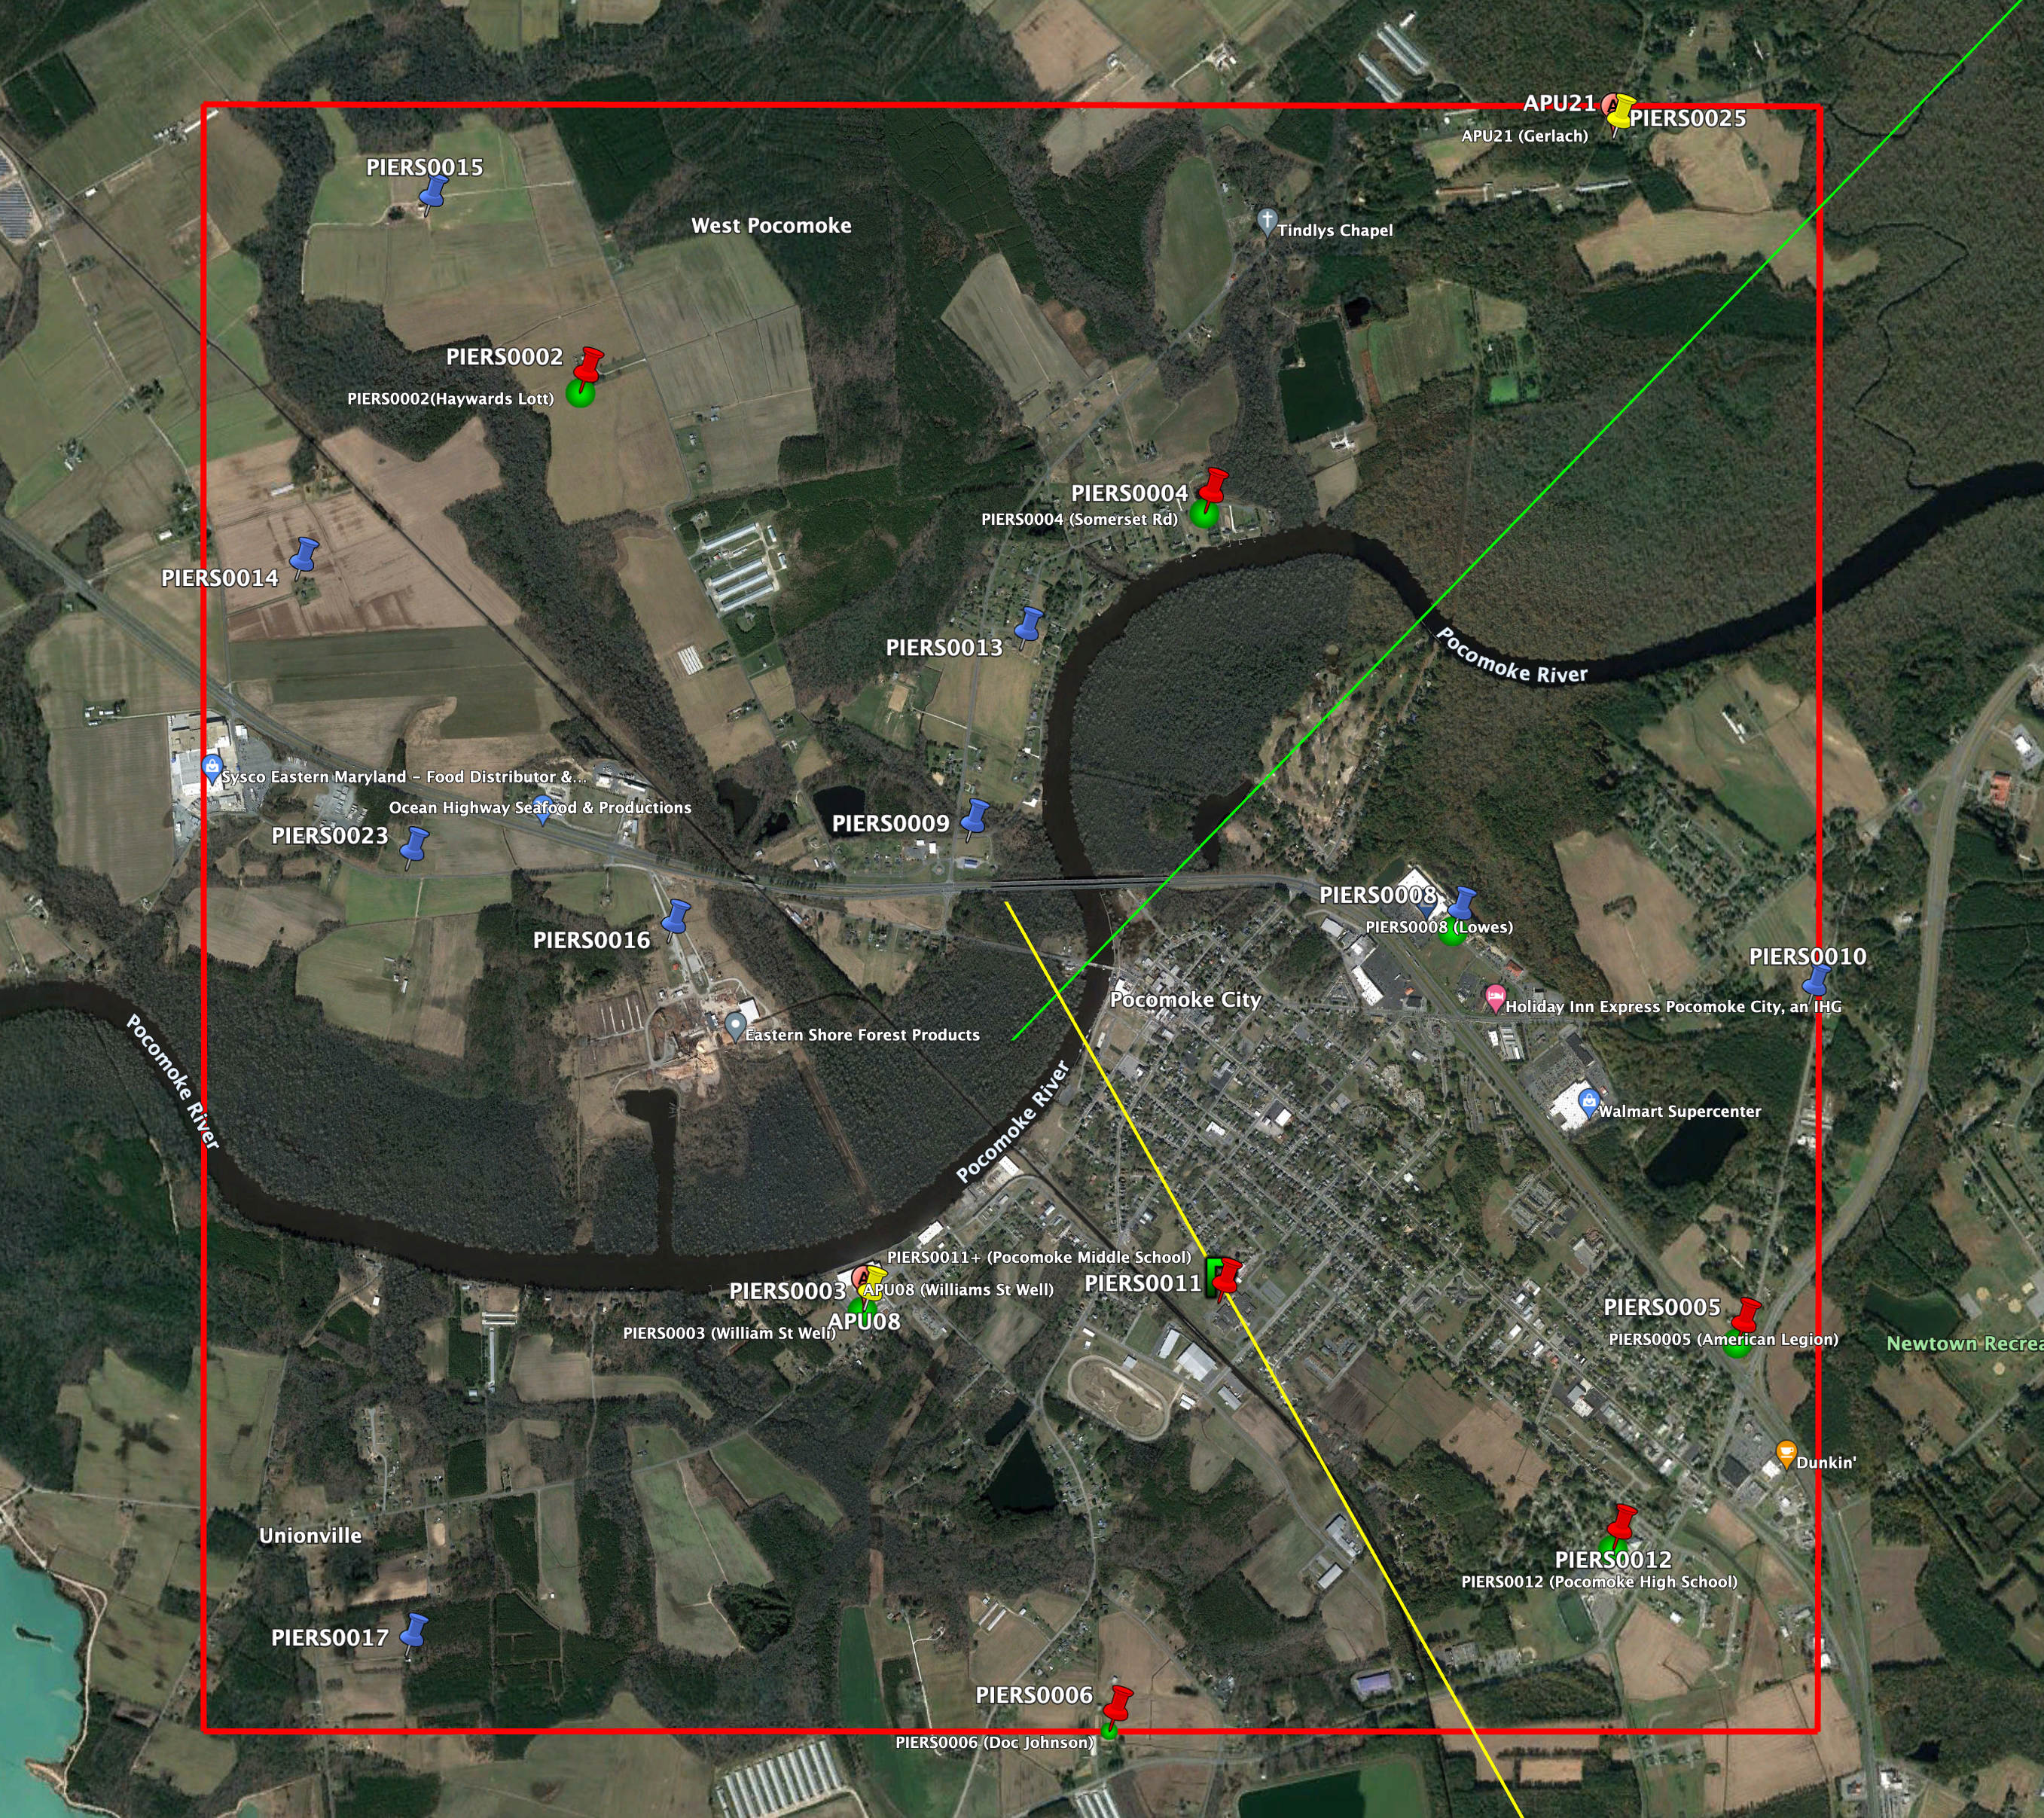
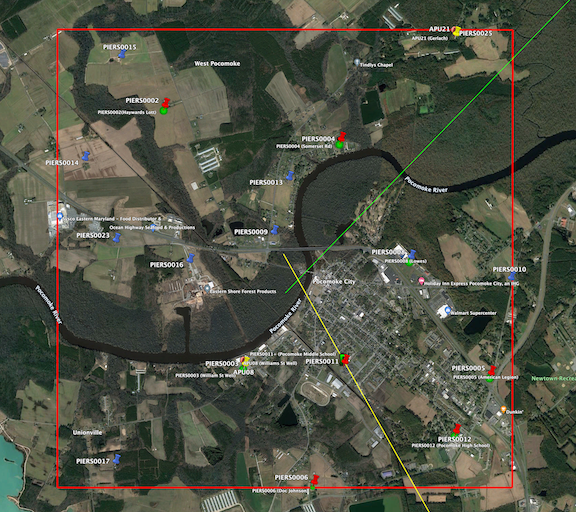
A high density gauge grid is located in an around Pocomoke City, MD is aimed
towards validating space-based estimates on the scale of the nominal GPM DPR
footprint size of about 5 km.
The second, larger grid, also includes the Pocomoke network, but it's scale is approximately
0.5 degrees (lat & lon). This network
will serve to better validate both DPR and GMI observations and is well sampled
by NASA's NPOL radar, which is
located in Newark, MD. The 0.5 degree scale is roughly bounded by Chincoteague, VA
to the southeast; Crisfield, MD to the southwest; Salisbury, MD to the north; and,
Newark, MD to the northeast.
GPM is also supporting NASA's
Improved Participation of Minority Serving Institution (IPMSI)
in STEM research. We have deployed gauges and disdrometer at several MSI' in
New York, Maryland, Virginia, Louisiana, Texas and Arizona. Click
here to visit our
IPMSI pages.
Current Daily Totals (All Gauges)
Current Report Date: 07/19/2026
Report generated 07/19/2026 @ 16:00:08 Local (07/19/2026 @ 20:00:08 UTC)
| GaugeID |
Site Name |
Packets |
Mean Voltage |
Mean RSSI |
# Tips_A |
# Tips_B |
Accum_A [in] |
Accum_A [mm] |
Accum_B [in] |
Accum_B [mm] |
Bias [%] |
| PIERS0001 |
WFF Pad |
79/96 |
13.190000 |
-80.110000 |
2 |
2 |
0.020000 |
0.510000 |
0.020000 |
0.510000 |
0.000000 |
| PIERS0002 |
Haywards_Lott |
79/96 |
13.160000 |
-87.000000 |
12 |
12 |
0.120000 |
3.050000 |
0.120000 |
3.050000 |
0.000000 |
| PIERS0003 |
William_St_Well |
79/96 |
13.030000 |
-96.320000 |
10 |
10 |
0.100000 |
2.540000 |
0.100000 |
2.540000 |
0.000000 |
| PIERS0004 |
Somerset_Rd |
79/96 |
12.890000 |
-83.150000 |
11 |
11 |
0.110000 |
2.790000 |
0.110000 |
2.790000 |
0.000000 |
| PIERS0005 |
American_Legion |
79/96 |
13.150000 |
-71.890000 |
9 |
10 |
0.090000 |
2.290000 |
0.100000 |
2.540000 |
-11.110000 |
| PIERS0006 |
Doc_Johnson |
79/96 |
13.140000 |
-86.390000 |
10 |
10 |
0.100000 |
2.540000 |
0.100000 |
2.540000 |
0.000000 |
| PIERS0007 |
LeVecque |
79/96 |
13.150000 |
-81.940000 |
3 |
2 |
0.030000 |
0.760000 |
0.020000 |
0.510000 |
33.330000 |
| PIERS0008 |
Lowes |
79/96 |
13.210000 |
-107.510000 |
11 |
13 |
0.110000 |
2.790000 |
0.130000 |
3.300000 |
-18.180000 |
| PIERS0011 |
Pocomoke_MS |
79/96 |
12.890000 |
-92.060000 |
9 |
10 |
0.090000 |
2.290000 |
0.100000 |
2.540000 |
-11.110000 |
| PIERS0012 |
Pocomoke_HS |
79/96 |
13.230000 |
-105.560000 |
11 |
10 |
0.110000 |
2.790000 |
0.100000 |
2.540000 |
9.090000 |
| PIERS0018 |
Stockton Volunteer Fire Company |
79/96 |
13.190000 |
-102.850000 |
8 |
10 |
0.080000 |
2.030000 |
0.100000 |
2.540000 |
-25.000000 |
| PIERS0021 |
How Sweet it is |
79/96 |
13.160000 |
-104.140000 |
8 |
9 |
0.080000 |
2.030000 |
0.090000 |
2.290000 |
-12.500000 |
| PIERS0024 |
Silva_Rd |
79/96 |
13.140000 |
-87.000000 |
4 |
5 |
0.040000 |
1.020000 |
0.050000 |
1.270000 |
-25.000000 |
| PIERS0026 |
UMES |
79/96 |
12.810000 |
-78.270000 |
13 |
12 |
0.130000 |
3.300000 |
0.120000 |
3.050000 |
7.690000 |
| PIERS0027 |
WFF Pad |
79/96 |
12.290000 |
-88.240000 |
3 |
2 |
0.030000 |
0.760000 |
0.020000 |
0.510000 |
33.330000 |
| PIERS0028 |
WFF Pad |
79/96 |
12.300000 |
-98.850000 |
3 |
2 |
0.030000 |
0.760000 |
0.020000 |
0.510000 |
33.330000 |
| PIERS0029 |
Lehman College, NYC |
79/96 |
13.110000 |
-57.000000 |
69 |
66 |
0.690000 |
17.530000 |
0.660000 |
16.760000 |
4.350000 |
| PIERS0030 |
Texas A&M University - Corpus Christi |
79/96 |
11.150000 |
-78.270000 |
0 |
0 |
0.000000 |
0.000000 |
0.000000 |
0.000000 |
0.000000 |
| PIERS0031 |
Xavier University |
79/96 |
12.970000 |
-110.160000 |
0 |
0 |
0.000000 |
0.000000 |
0.000000 |
0.000000 |
0.000000 |
| PIERS0032 |
Texas Tech University |
79/96 |
13.260000 |
-109.280000 |
3 |
3 |
0.030000 |
0.760000 |
0.030000 |
0.760000 |
0.000000 |
| PIERS0033 |
University of Arizona |
79/96 |
13.230000 |
-108.040000 |
0 |
0 |
0.000000 |
0.000000 |
0.000000 |
0.000000 |
0.000000 |
| PIERS0034 |
Prairie View A&M University |
79/96 |
12.730000 |
-88.190000 |
0 |
0 |
0.000000 |
0.000000 |
0.000000 |
0.000000 |
0.000000 |
| PIERS0035 |
Prairie View A&M University |
79/96 |
12.910000 |
-61.250000 |
0 |
0 |
0.000000 |
0.000000 |
0.000000 |
0.000000 |
0.000000 |
| PIERS0036 |
Prairie View A&M University |
79/96 |
11.230000 |
-62.540000 |
0 |
0 |
0.000000 |
0.000000 |
0.000000 |
0.000000 |
0.000000 |
| PIERS0037 |
INCUS experiment - Fort Collins, CO |
35/96 |
9.960000 |
-101.110000 |
0 |
0 |
0.000000 |
0.000000 |
0.000000 |
0.000000 |
0.000000 |
| PIERS0038 |
Hampton University - CBBT, Island Three |
79/96 |
12.890000 |
-85.350000 |
0 |
0 |
0.000000 |
0.000000 |
0.000000 |
0.000000 |
0.000000 |
| PIERS0039 |
NPOL Radar |
79/96 |
13.070000 |
-90.920000 |
18 |
19 |
0.180000 |
4.570000 |
0.190000 |
4.830000 |
-5.560000 |
| PIERS0040 |
Redden Farm |
79/96 |
13.140000 |
-101.840000 |
11 |
11 |
0.110000 |
2.790000 |
0.110000 |
2.790000 |
0.000000 |
| PIERS0041 |
GSFC/Greenbelt - B33 Rooftop |
79/96 |
12.750000 |
-86.950000 |
1 |
0 |
0.010000 |
0.250000 |
0.000000 |
0.000000 |
100.000000 |
| PIERS0042 |
WFF Pad |
79/96 |
12.500000 |
-94.820000 |
1 |
2 |
0.010000 |
0.250000 |
0.020000 |
0.510000 |
-100.000000 |
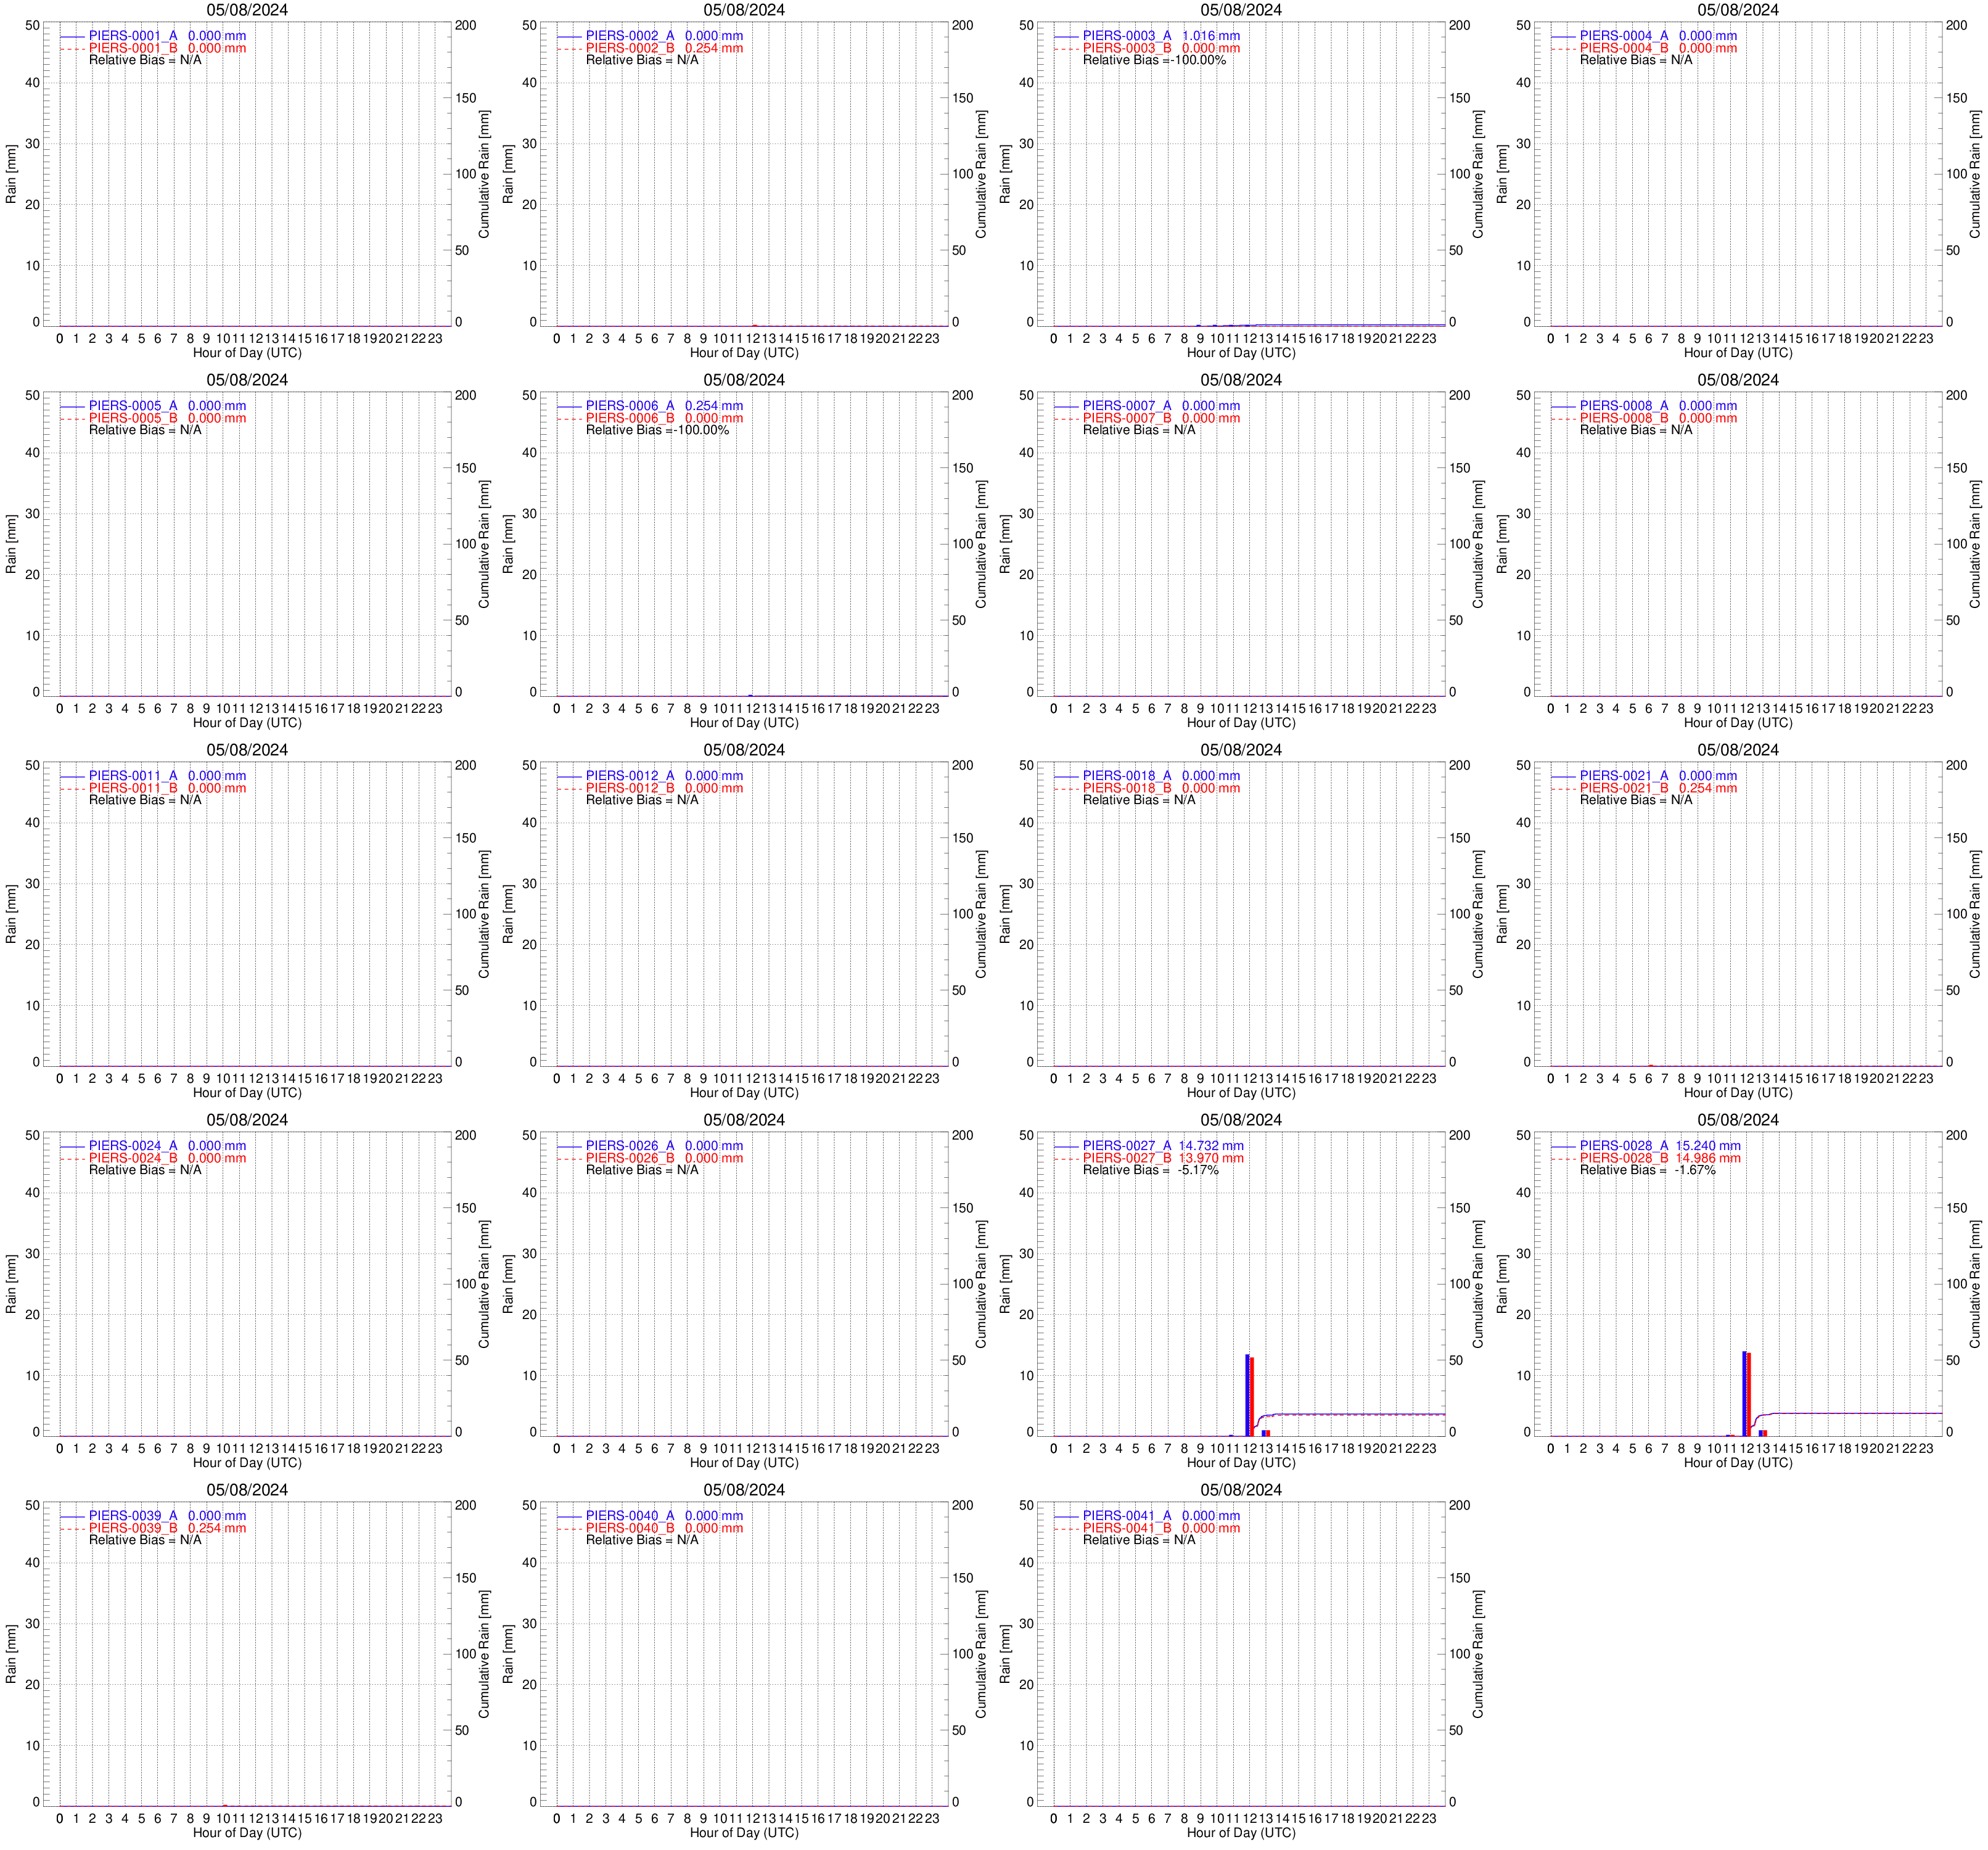
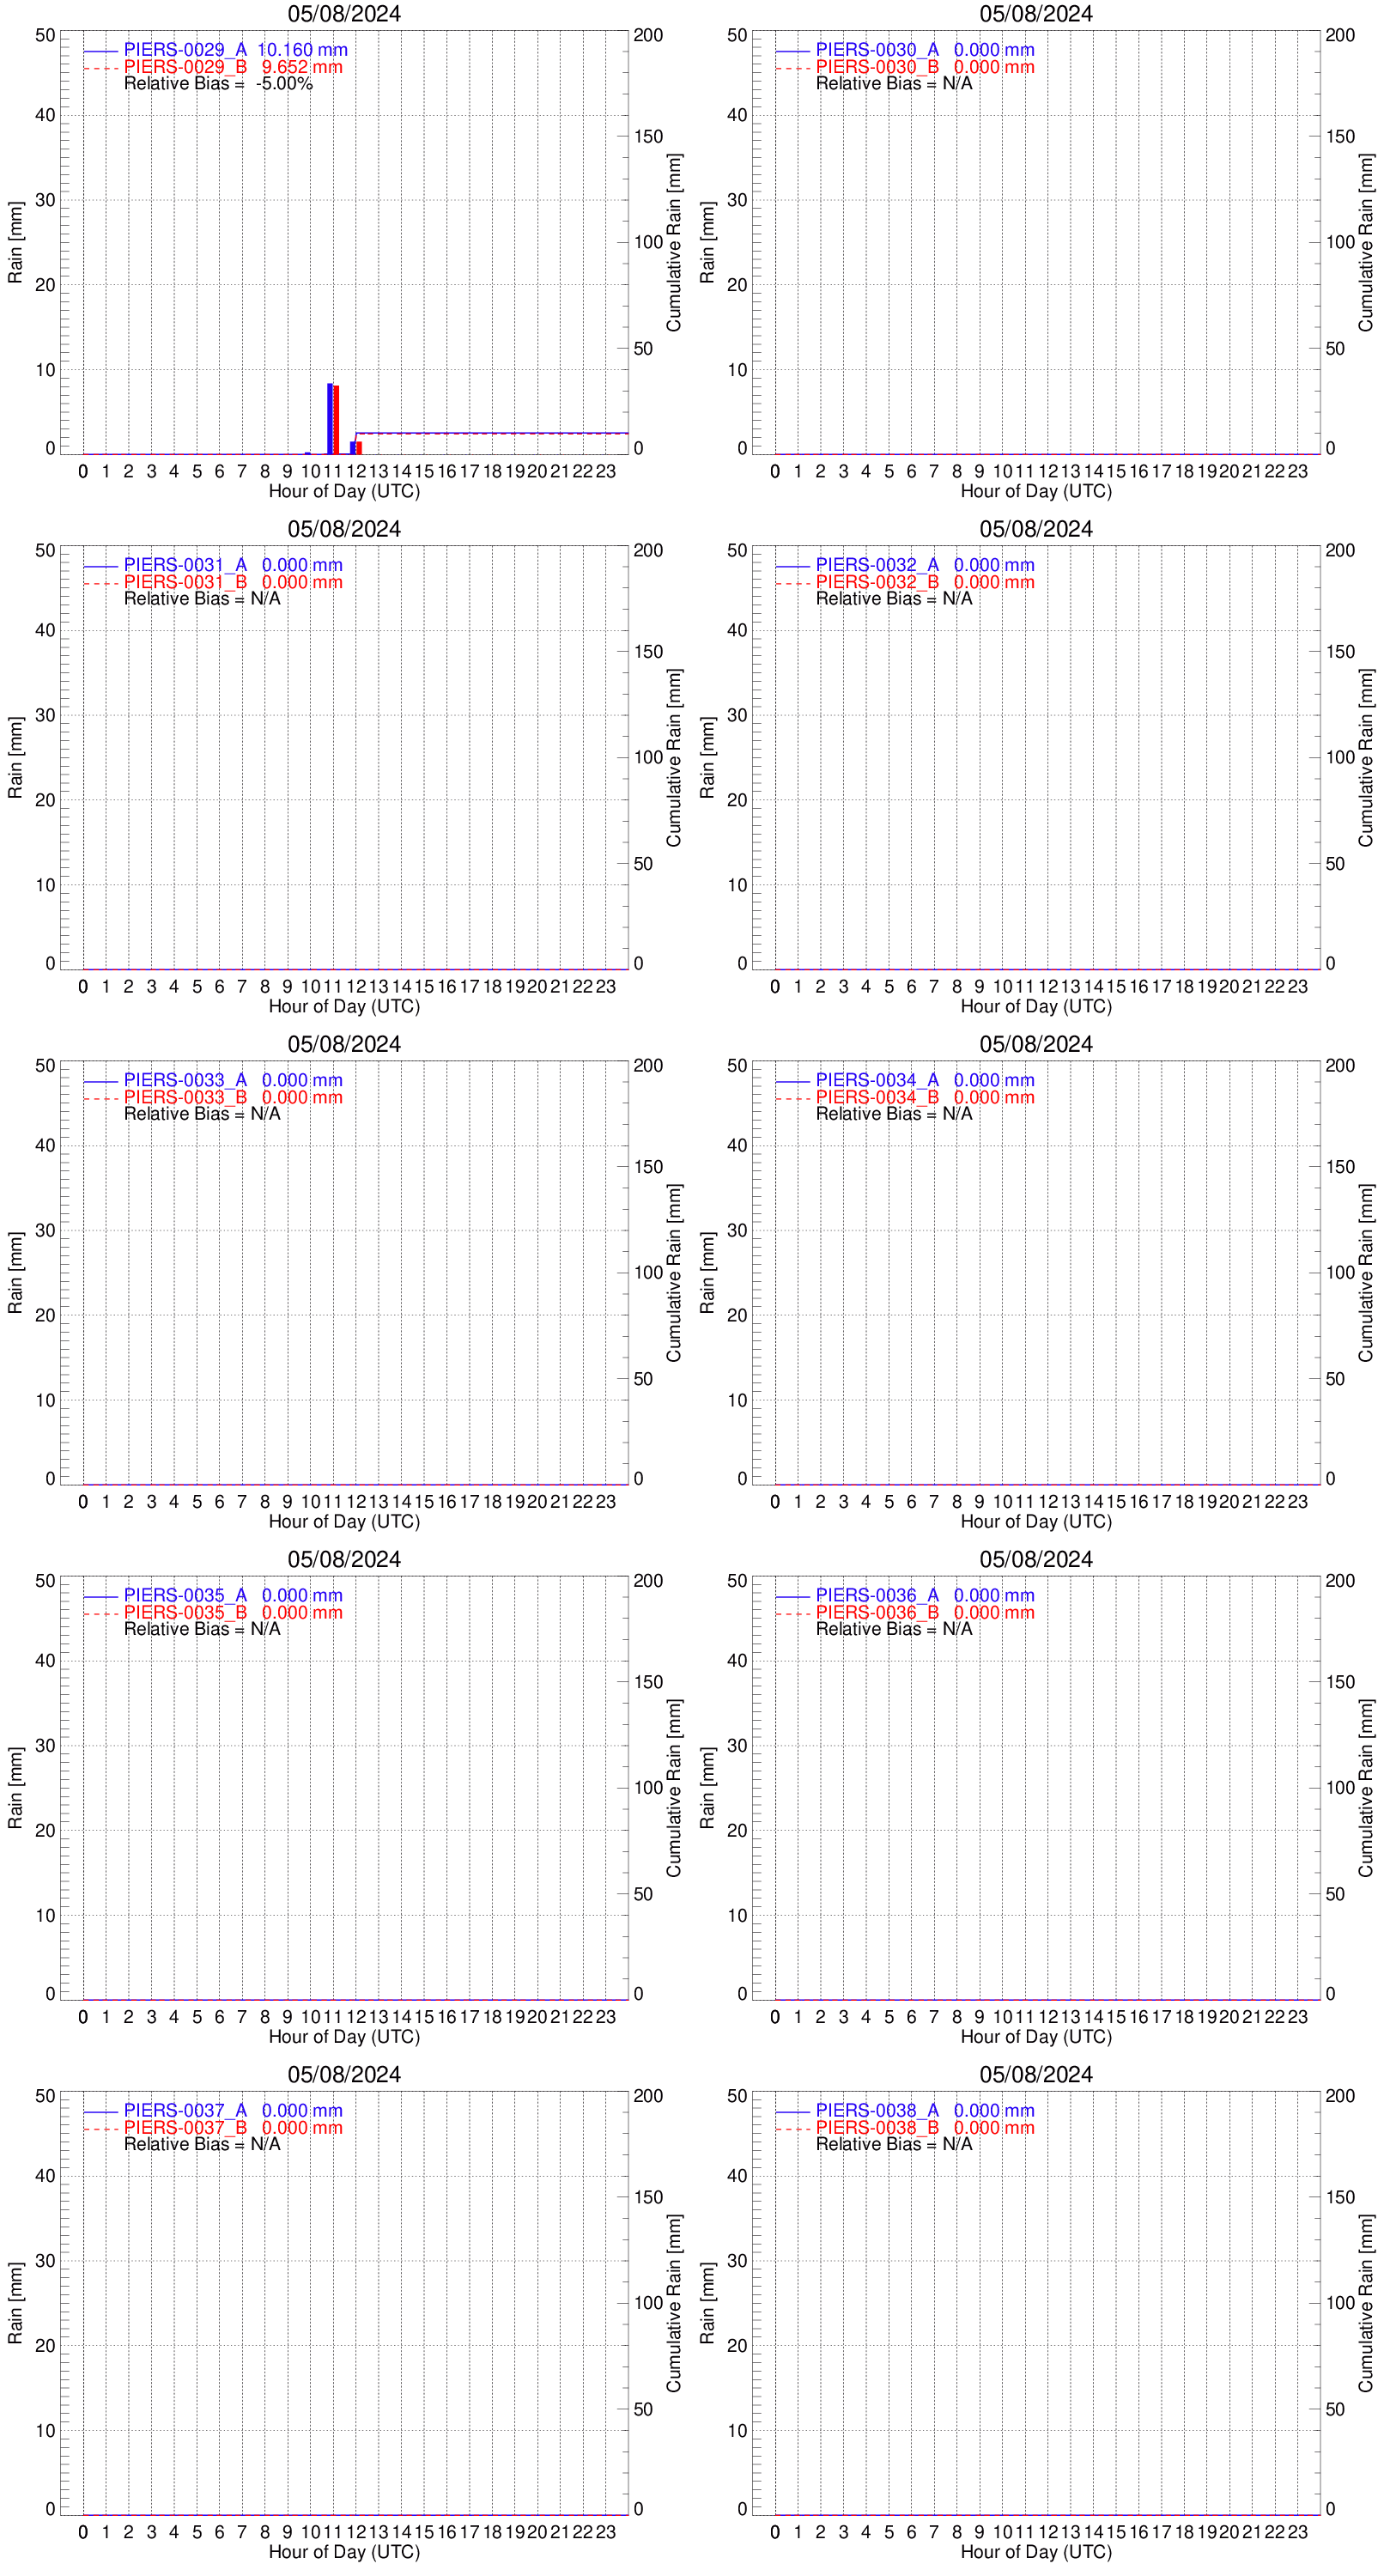
Pocomoke Rain Gauges
GPM gauges
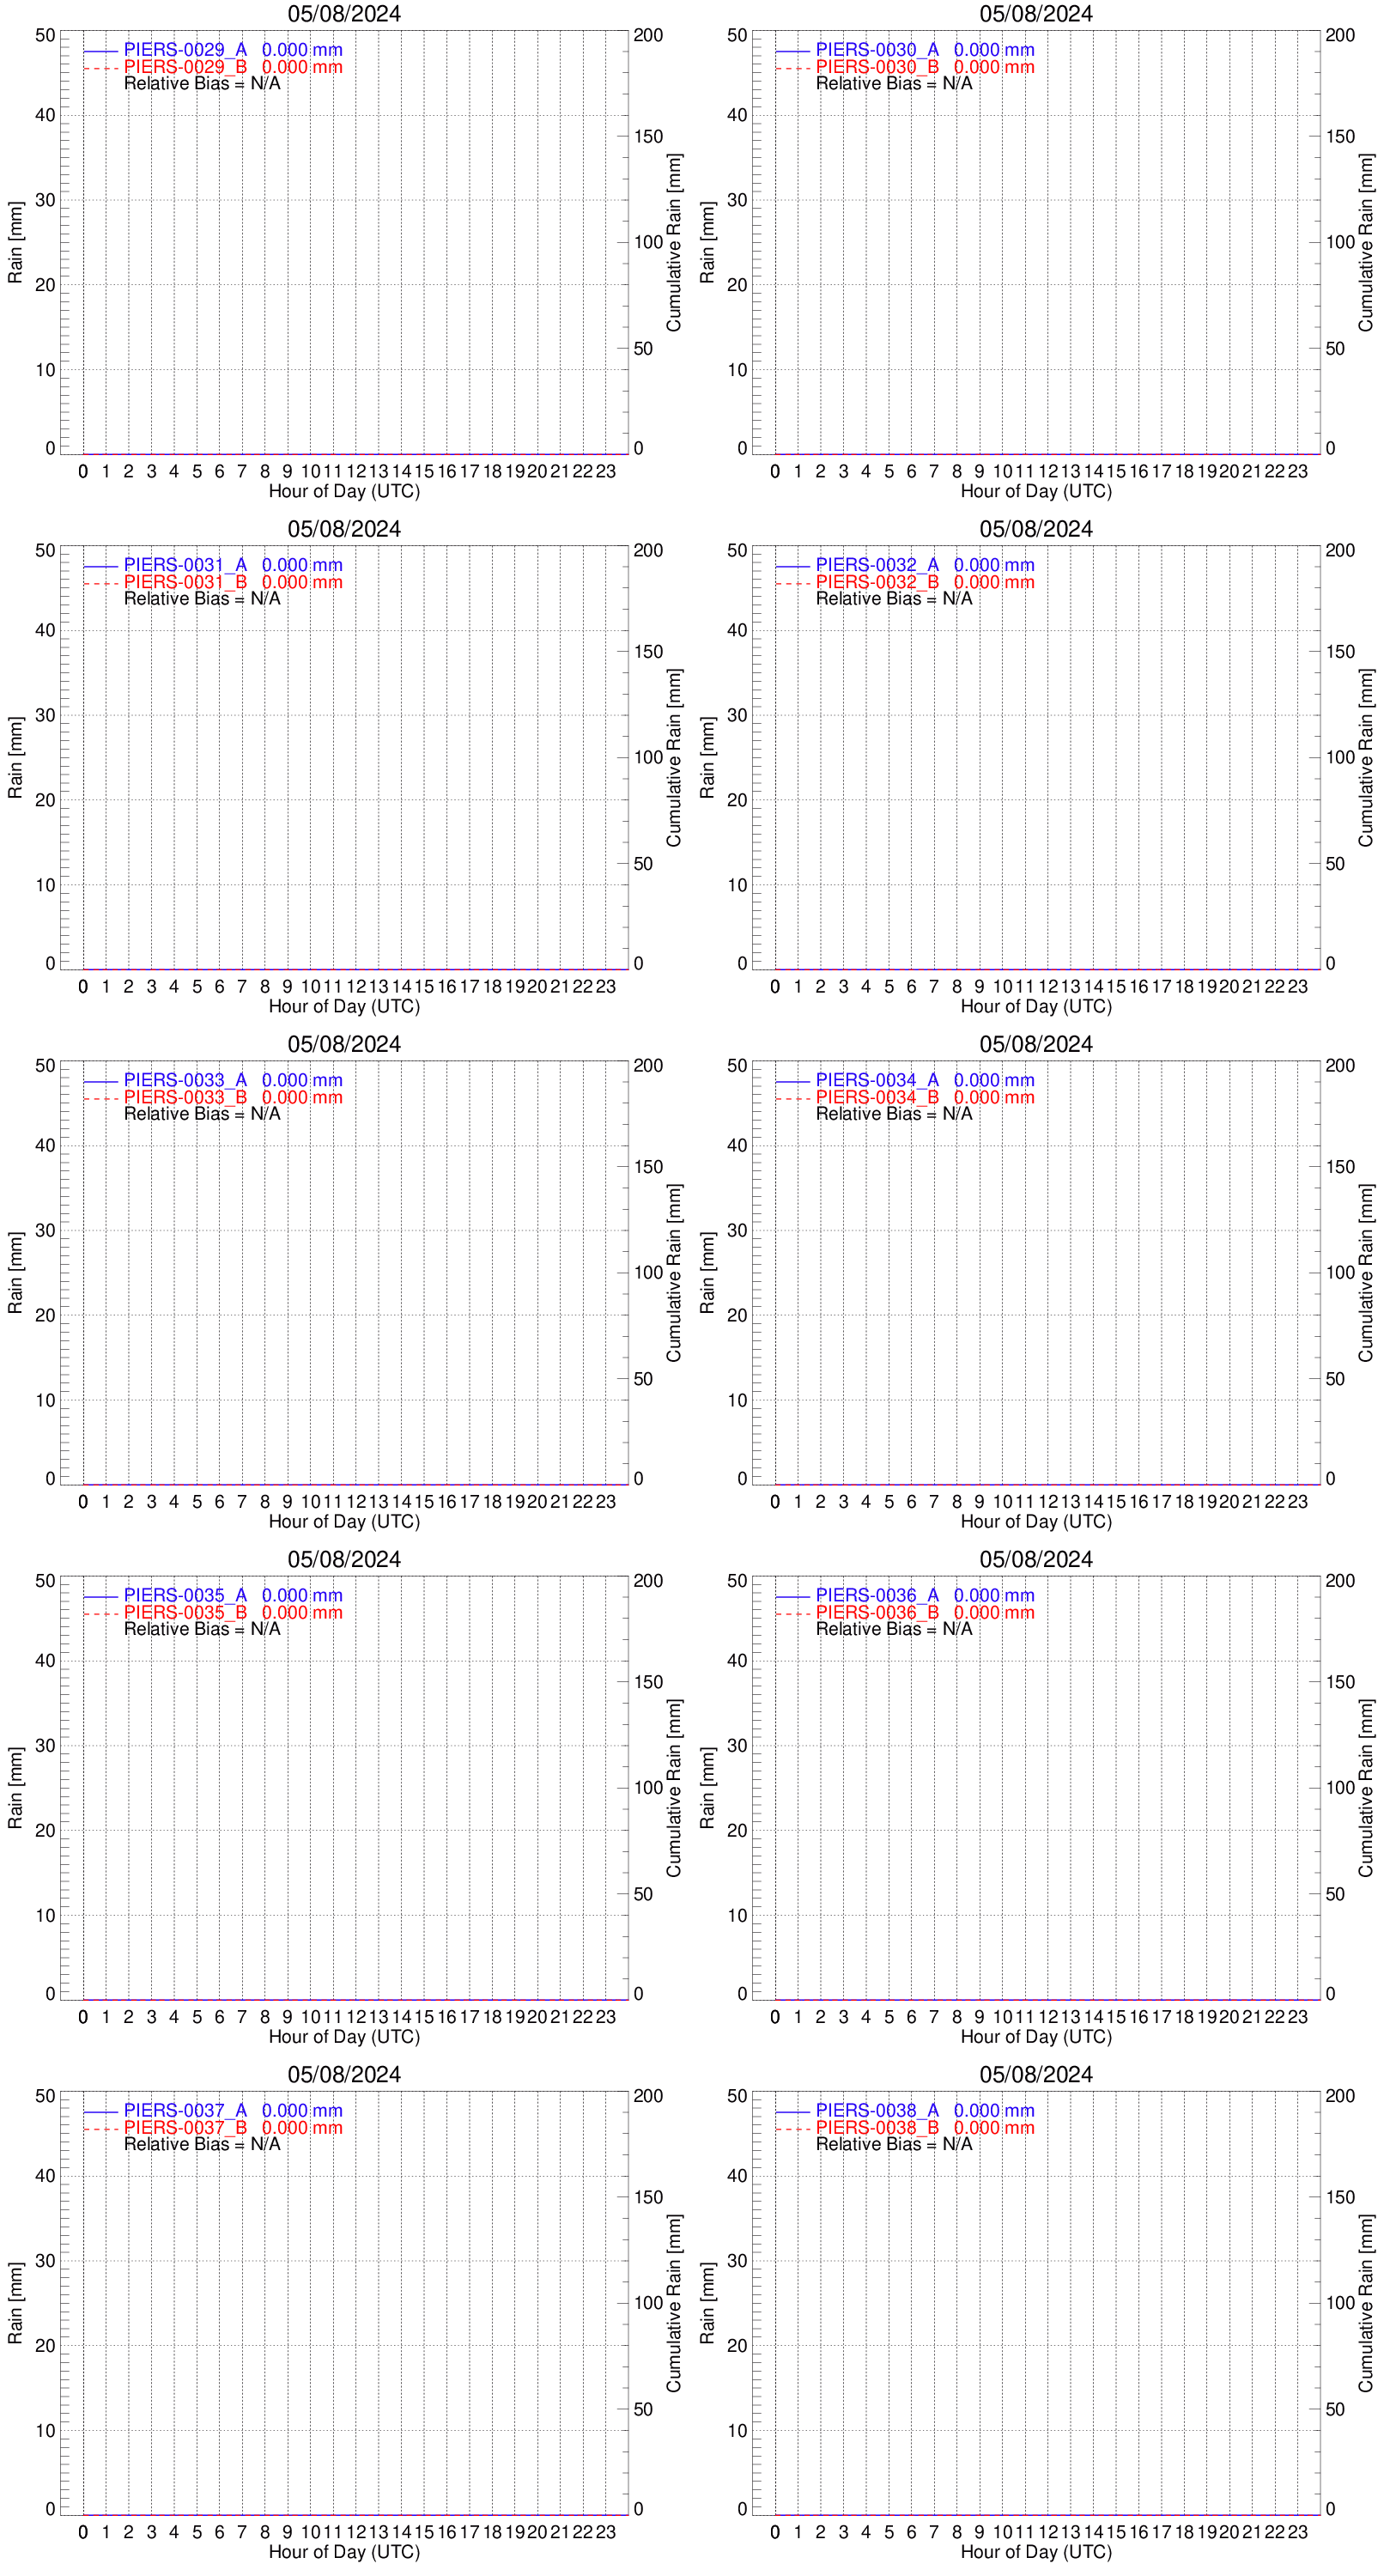
| Hourly/Daily Rain Plot |
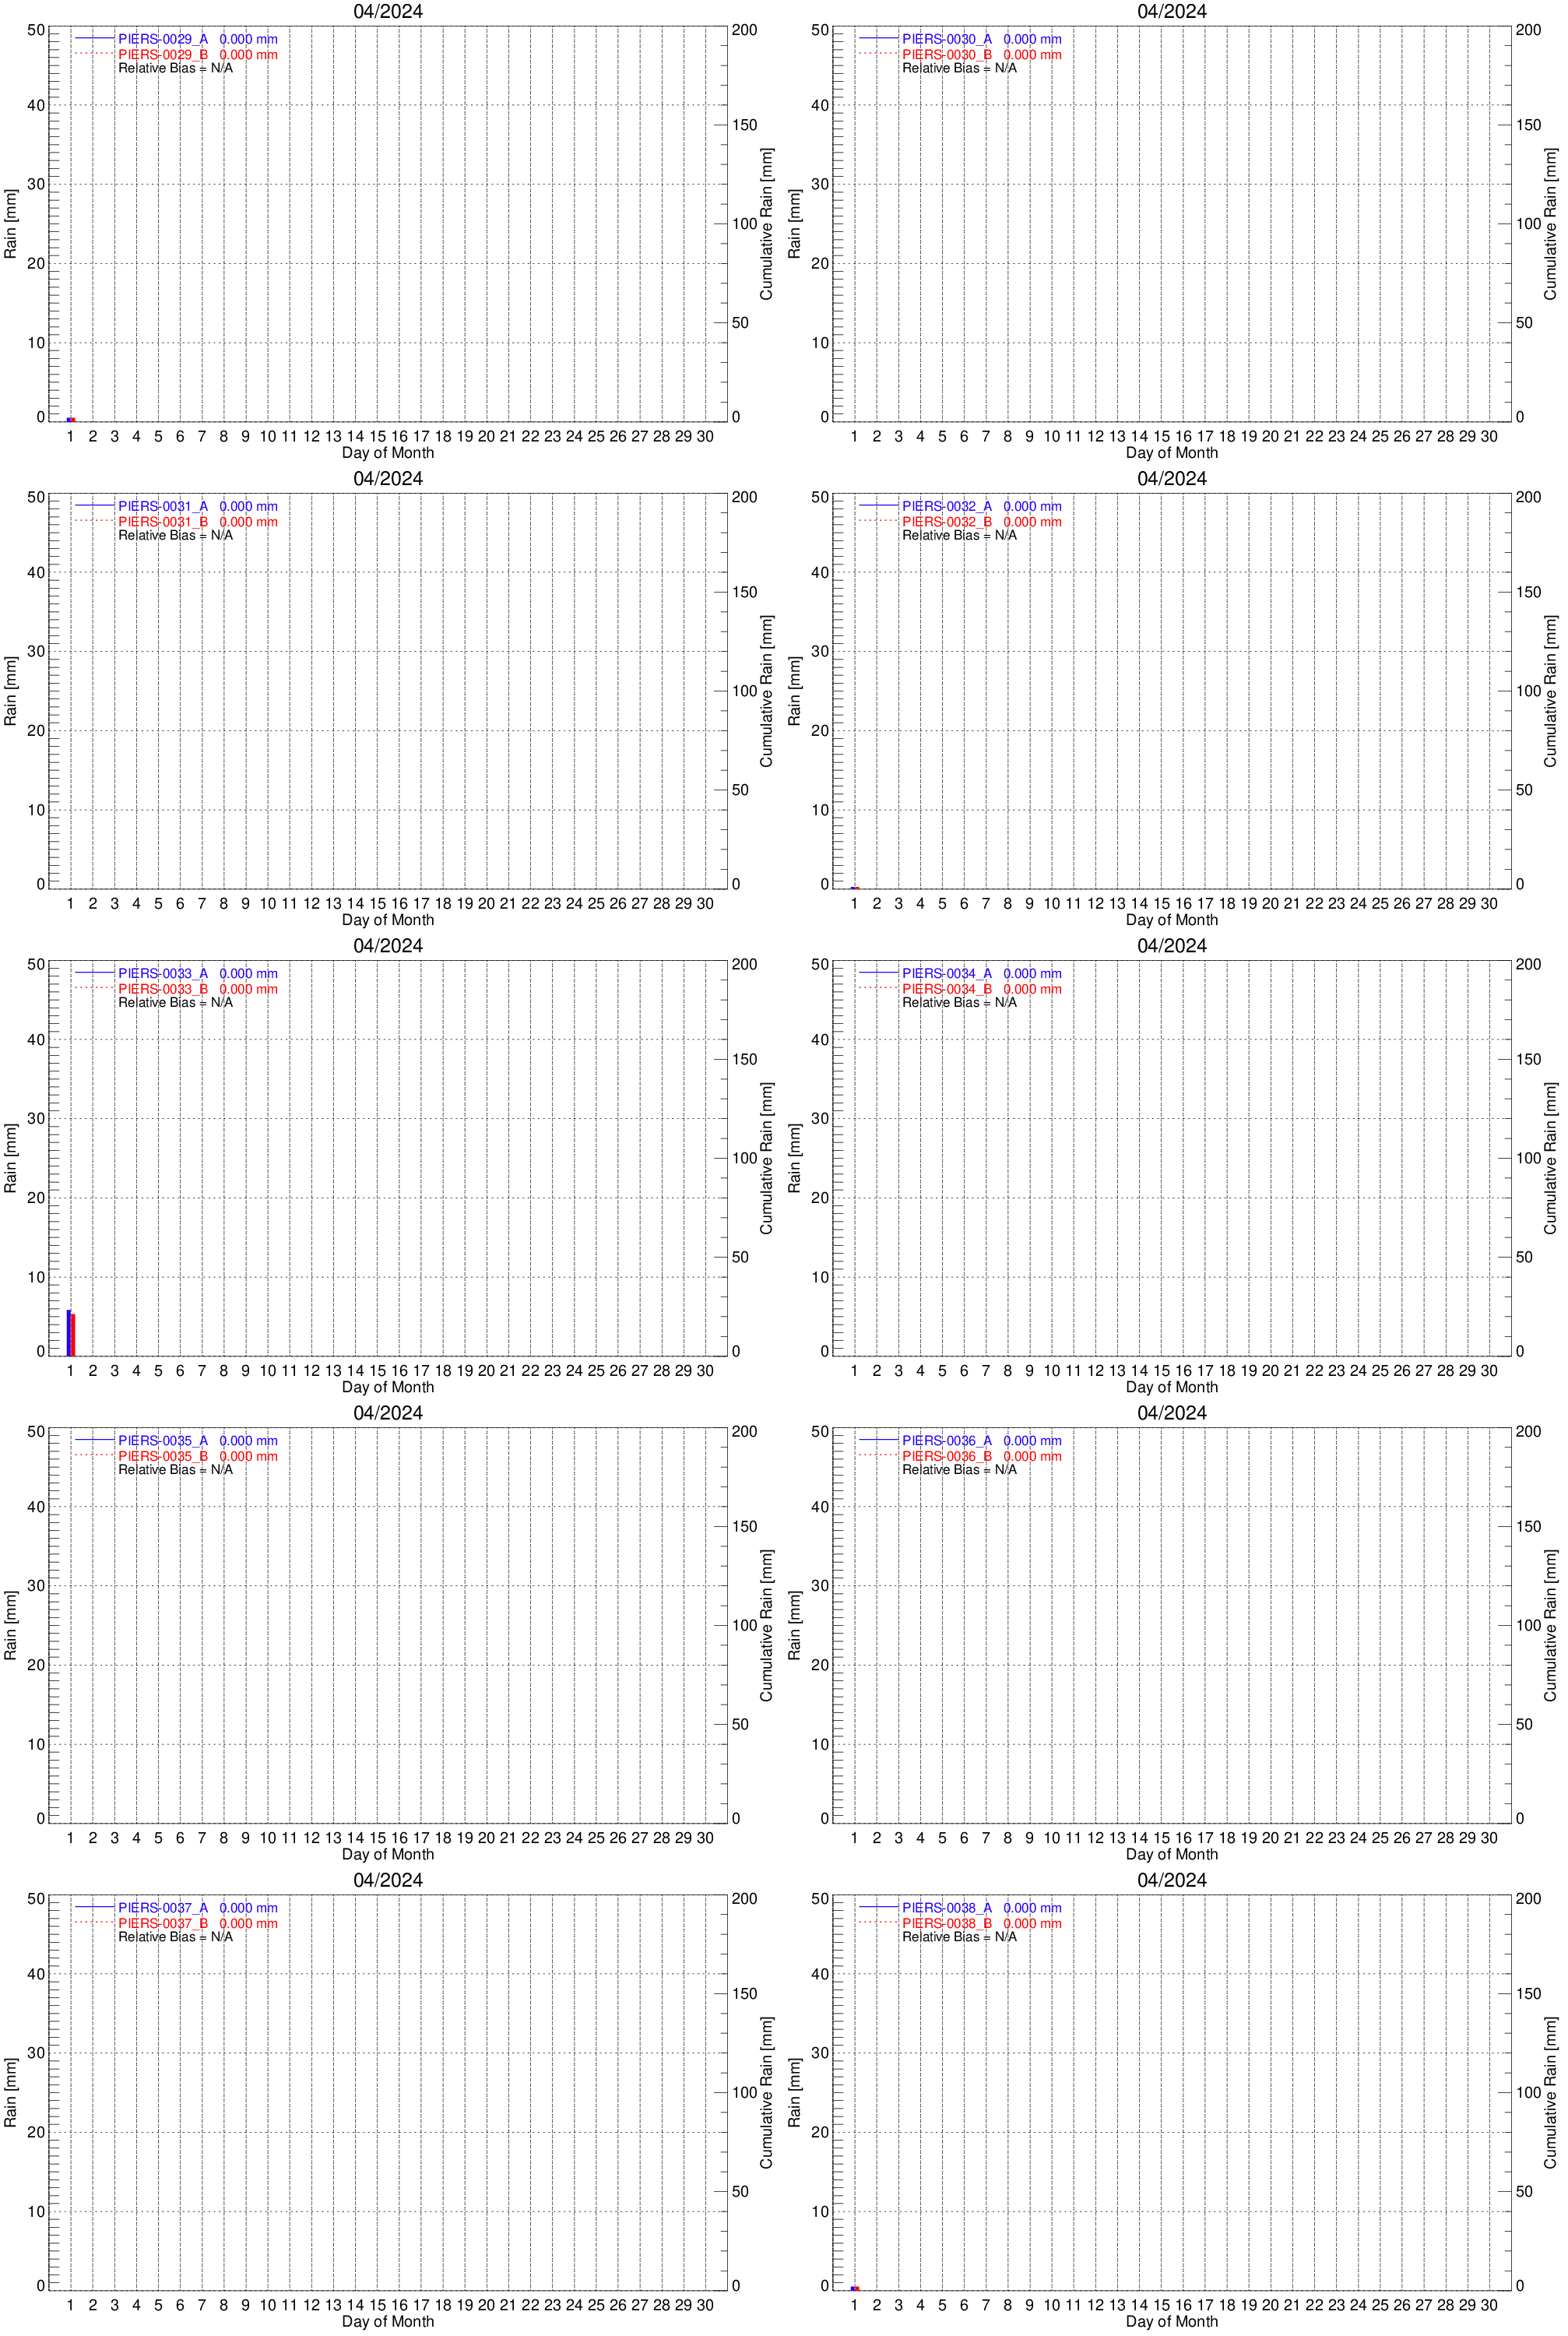
Daily/Monthly Rain Plot |
|
|
IPMSI gauges
| Hourly/Daily Rain Plot |
Daily/Monthly Rain Plot |
|
|
(Started from 11/2022)
Other Gauge Quick Look Products
PIERS Platform Data [24hr]
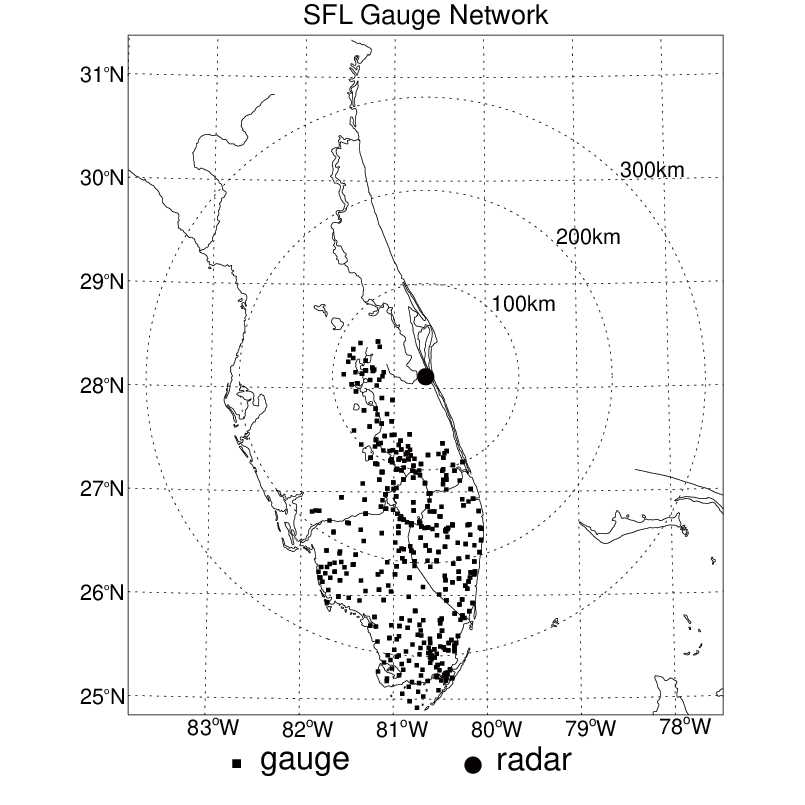
SFL Gauges
As of 11/2025, there are 204 active tipping bucket gauges in SFL network.
We routinely request raw SFL gauge data from South Florida Water management District Website at http://www.sfwmd.gov/.
The raw data from some SFL gauges are available on daily basis but some are delayed for several months or even discontinued.
Click here for more information.
|