IPMSI Precipitation Validation
Increasing Participation of Minority Serving Institutions in Earth Science
Division Surface-Based Measurement Networks
In 2021, NASA Heaquarters (HQ) issued a Research Opportunities in Space and Earth Sciences (ROSES) opportunity
to address "Increasing Participation of Minority Serving Institutions (MSI) in Earth Science Division Surface-Based
Measurement Networks". The goal was to provide ground-based instruments to MSI in order to better engage these
communities in NASA Earth Science Division (ESD) Science, Technology, Engineering and Math (STEM) activities.
A total of 22 proposals were submitted, from which 15 were selected for funding.
The call was to provide one or more ground-based platforms consisting of AERONET, PANDORA and Precipitation Stations.
The Precipitation Stations, which we discuss here, are being provided by the GPM Ground Validation program, and
consists of a pair of rain gauges and for some a Parsivel Disdrometer. Of the 15 selected sites, eight chose
the precipitation systems. The gauge-only systems are referred to as Platforms for In situ Estimation of Rainfall Systems
(PIERS), while the gauge + disdrometer systems are referred to as PIERS+.
Precipitation Validation Network

The map above illustrates the selected MSIs. The institutions that requested PIERS systems are denoted with
yellow circles and the sites denoted by the yellow squares denotes PIERS+ systems.
Links to PIERS and PIERS+ pages
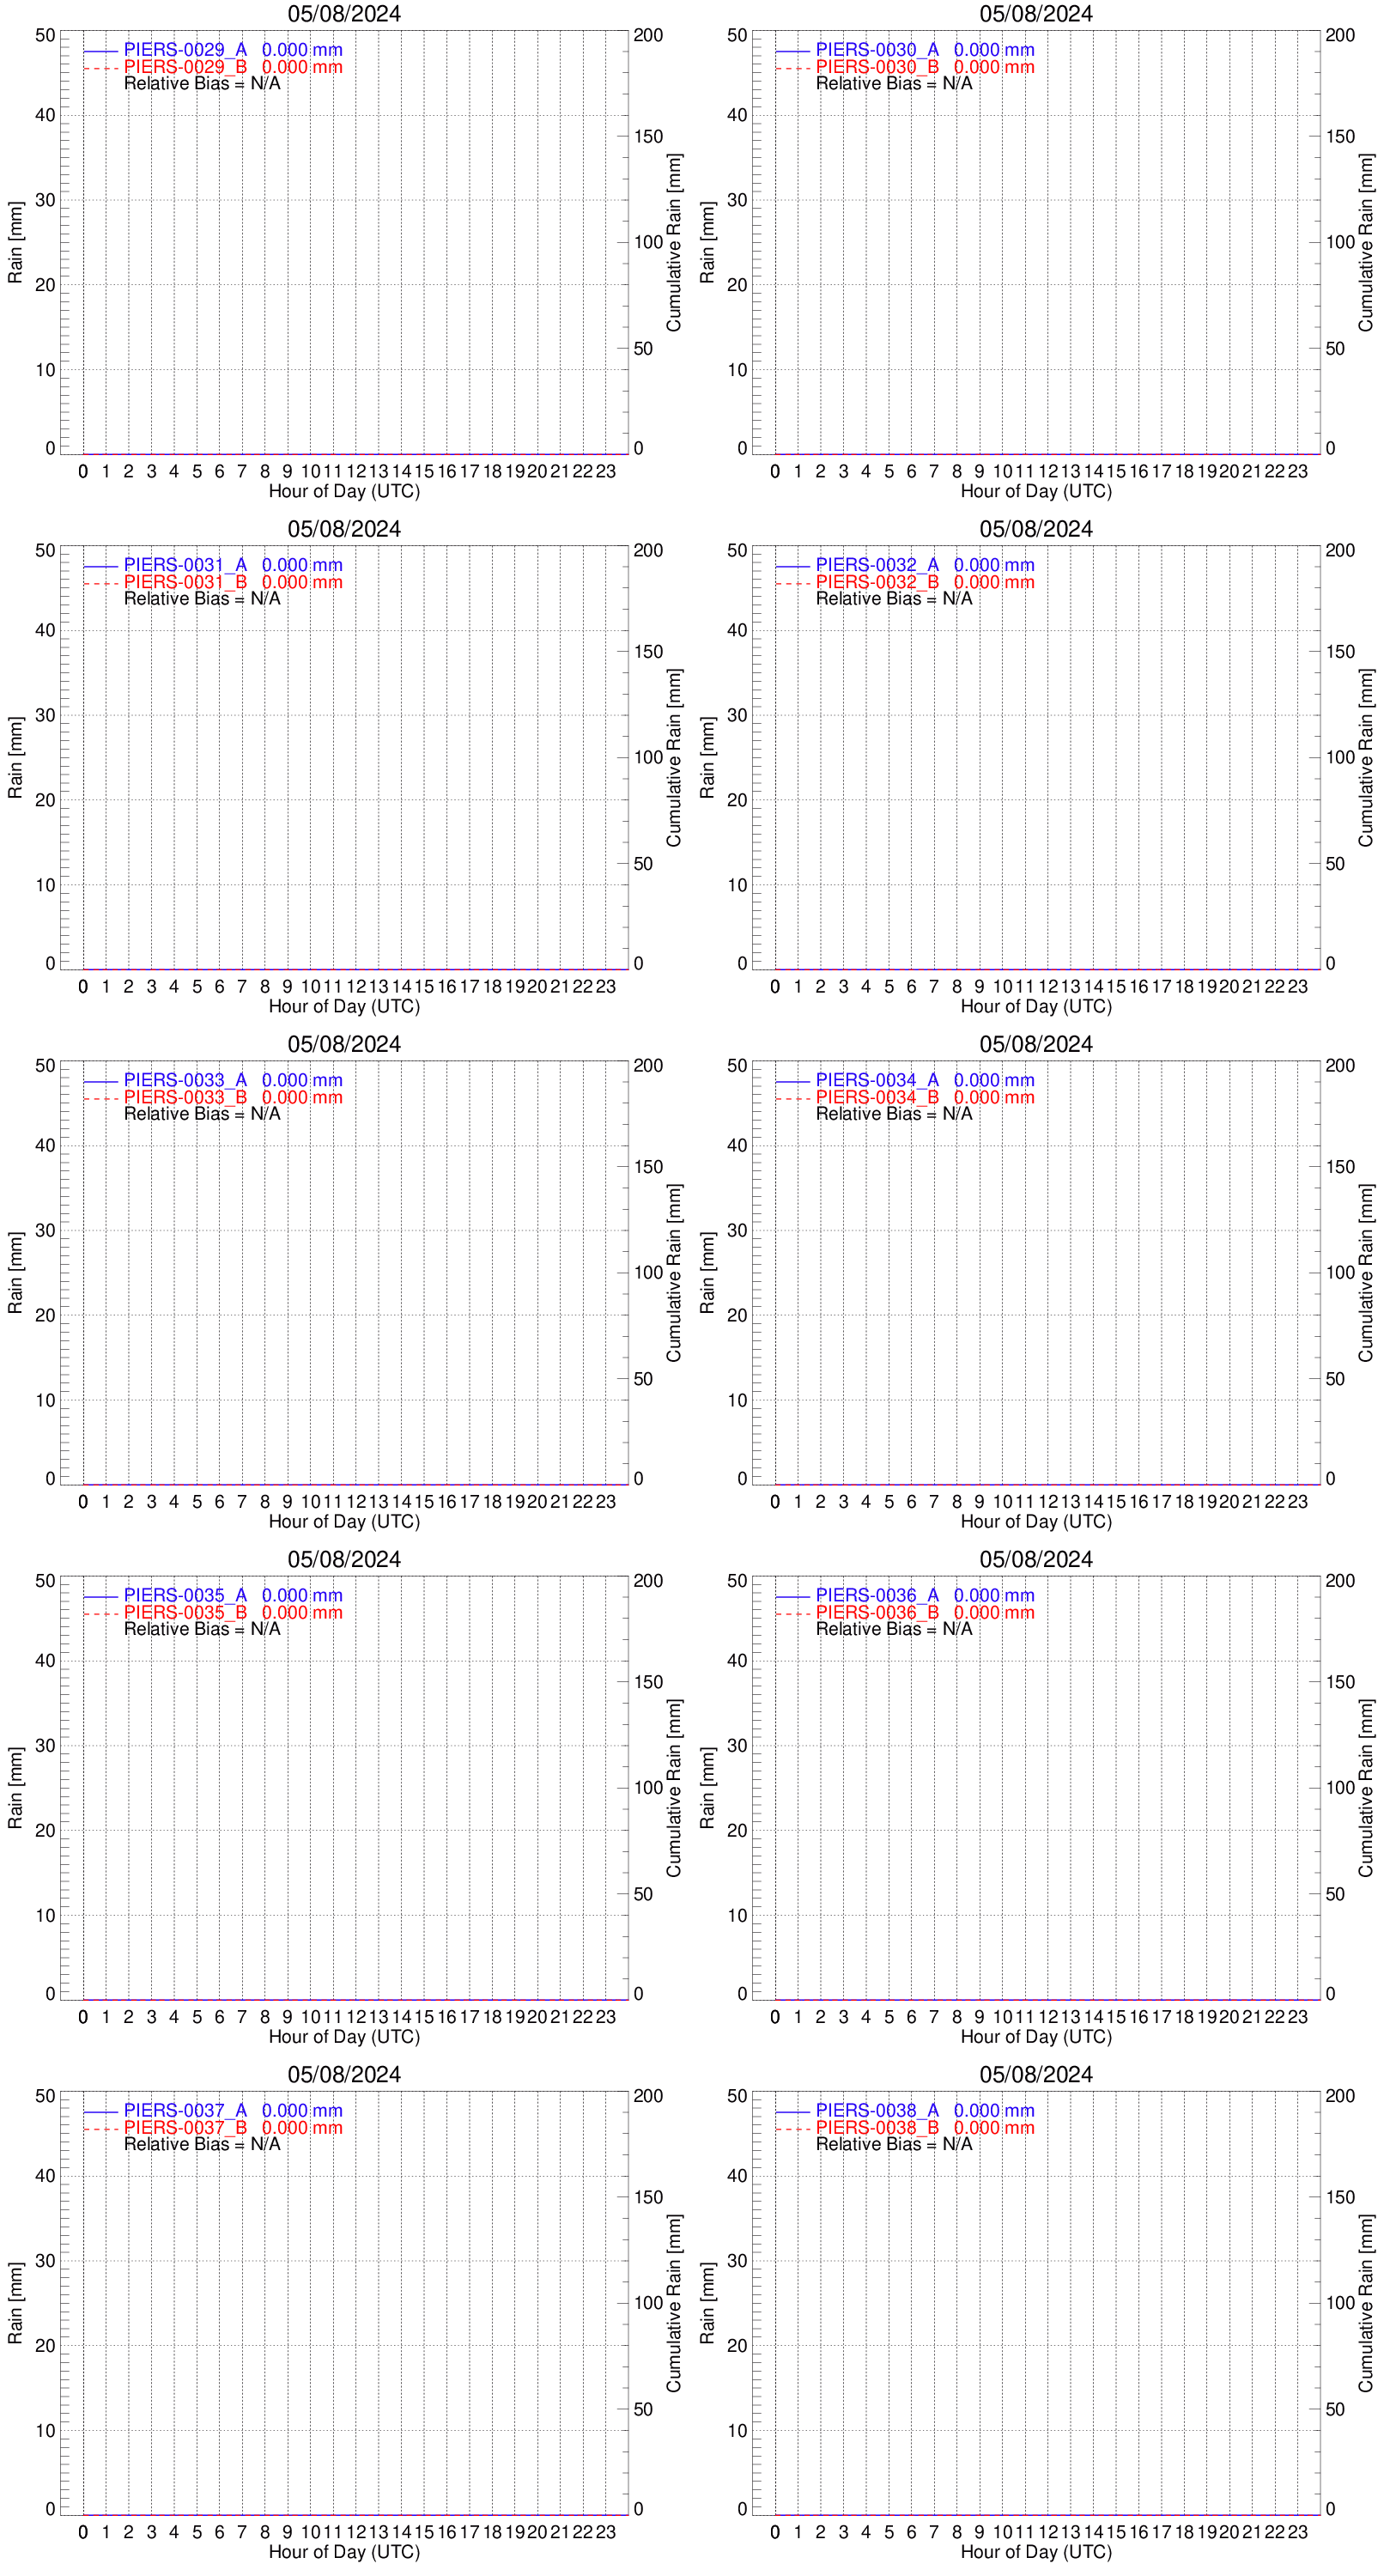
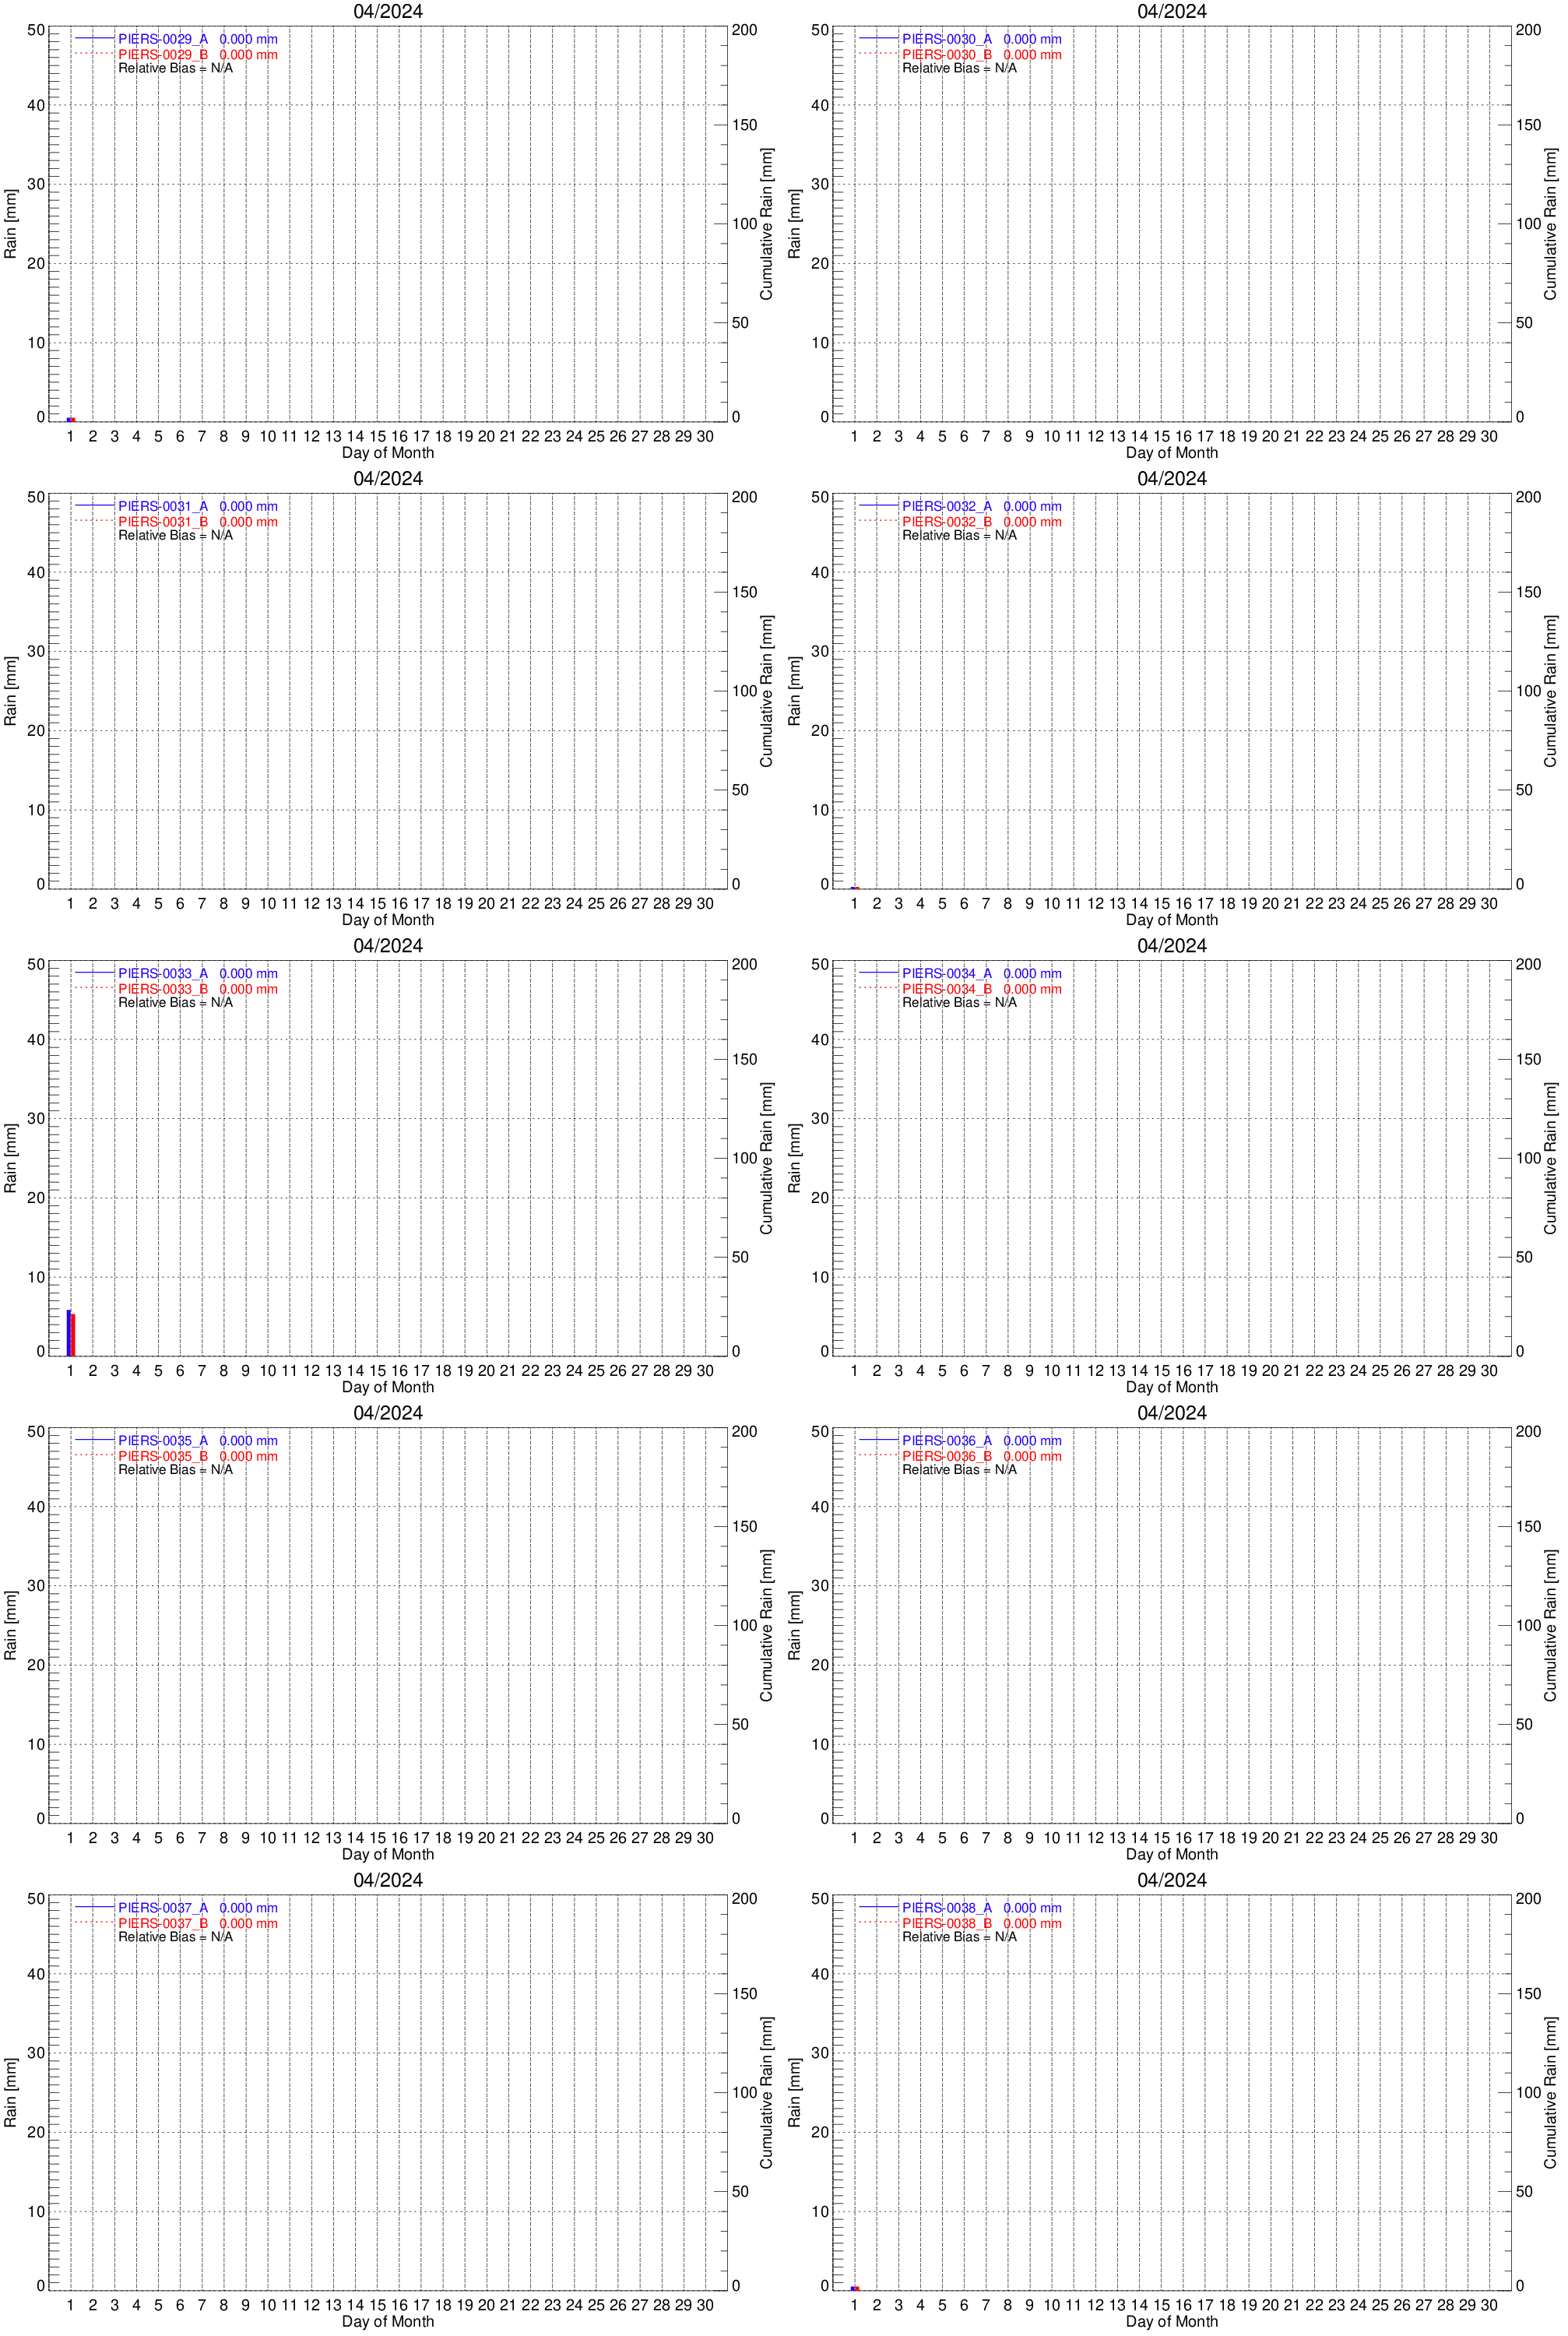
Daily and Monthly Plots for IPMSI Gauges
| Hourly/Daily Rain Plot |
Daily/Monthly Rain Plot |
|
|
(Started from 11/2022)
Current IPMSI Daily Gauge Totals
Current Report Date: 06/23/2026
Report generated 06/23/2026 @ 18:40:09 Local (06/23/2026 @ 22:40:09 UTC)
| GaugeID |
Site Name |
Packets |
Mean Voltage |
Mean RSSI |
# Tips_A |
# Tips_B |
Accum_A [in] |
Accum_A [mm] |
Accum_B [in] |
Accum_B [mm] |
Bias [%] |
| PIERS0001 |
WFF Pad |
90/96 |
13.240000 |
-79.000000 |
147 |
142 |
1.470000 |
37.340000 |
1.420000 |
36.070000 |
3.400000 |
| PIERS0002 |
Haywards_Lott |
90/96 |
13.250000 |
-86.110000 |
196 |
201 |
1.960000 |
49.780000 |
2.010000 |
51.050000 |
-2.550000 |
| PIERS0003 |
William_St_Well |
90/96 |
13.050000 |
-95.330000 |
160 |
157 |
1.600000 |
40.640000 |
1.570000 |
39.880000 |
1.880000 |
| PIERS0004 |
Somerset_Rd |
90/96 |
12.970000 |
-82.910000 |
162 |
160 |
1.620000 |
41.150000 |
1.600000 |
40.640000 |
1.230000 |
| PIERS0005 |
American_Legion |
90/96 |
13.200000 |
-71.530000 |
160 |
164 |
1.600000 |
40.640000 |
1.640000 |
41.660000 |
-2.500000 |
| PIERS0006 |
Doc_Johnson |
90/96 |
13.220000 |
-83.270000 |
153 |
154 |
1.530000 |
38.860000 |
1.540000 |
39.120000 |
-0.650000 |
| PIERS0007 |
LeVecque |
88/96 |
13.190000 |
-84.820000 |
167 |
175 |
1.670000 |
42.420000 |
1.750000 |
44.450000 |
-4.790000 |
| PIERS0008 |
Lowes |
90/96 |
13.270000 |
-99.510000 |
159 |
171 |
1.590000 |
40.390000 |
1.710000 |
43.430000 |
-7.550000 |
| PIERS0011 |
Pocomoke_MS |
90/96 |
12.880000 |
-84.240000 |
145 |
145 |
1.450000 |
36.830000 |
1.450000 |
36.830000 |
0.000000 |
| PIERS0012 |
Pocomoke_HS |
90/96 |
13.270000 |
-92.470000 |
153 |
152 |
1.530000 |
38.860000 |
1.520000 |
38.610000 |
0.650000 |
| PIERS0018 |
Stockton Volunteer Fire Company |
90/96 |
13.240000 |
-101.670000 |
145 |
152 |
1.450000 |
36.830000 |
1.520000 |
38.610000 |
-4.830000 |
| PIERS0021 |
How Sweet it is |
90/96 |
13.240000 |
-92.160000 |
166 |
162 |
1.660000 |
42.160000 |
1.620000 |
41.150000 |
2.410000 |
| PIERS0024 |
Silva_Rd |
90/96 |
13.170000 |
-86.760000 |
168 |
166 |
1.680000 |
42.670000 |
1.660000 |
42.160000 |
1.190000 |
| PIERS0026 |
UMES |
90/96 |
12.800000 |
-72.560000 |
182 |
177 |
1.820000 |
46.230000 |
1.770000 |
44.960000 |
2.750000 |
| PIERS0027 |
WFF Pad |
90/96 |
12.300000 |
-85.930000 |
208 |
136 |
2.080000 |
52.830000 |
1.360000 |
34.540000 |
34.620000 |
| PIERS0028 |
UCONN - GAIL site |
90/96 |
12.300000 |
-93.620000 |
0 |
138 |
0.000000 |
0.000000 |
1.380000 |
35.050000 |
0.000000 |
| PIERS0029 |
Lehman College, NYC |
90/96 |
13.090000 |
-57.000000 |
73 |
72 |
0.730000 |
18.540000 |
0.720000 |
18.290000 |
1.370000 |
| PIERS0030 |
Texas A&M University - Corpus Christi |
90/96 |
11.360000 |
-77.690000 |
0 |
0 |
0.000000 |
0.000000 |
0.000000 |
0.000000 |
0.000000 |
| PIERS0031 |
Xavier University |
90/96 |
13.040000 |
-112.380000 |
0 |
0 |
0.000000 |
0.000000 |
0.000000 |
0.000000 |
0.000000 |
| PIERS0032 |
Texas Tech University |
90/96 |
13.300000 |
-112.070000 |
0 |
0 |
0.000000 |
0.000000 |
0.000000 |
0.000000 |
0.000000 |
| PIERS0033 |
University of Arizona |
90/96 |
13.210000 |
-109.270000 |
19 |
5 |
0.190000 |
4.830000 |
0.050000 |
1.270000 |
73.680000 |
| PIERS0034 |
Prairie View A&M University |
90/96 |
12.790000 |
-87.020000 |
0 |
0 |
0.000000 |
0.000000 |
0.000000 |
0.000000 |
0.000000 |
| PIERS0035 |
Prairie View A&M University |
90/96 |
12.960000 |
-61.980000 |
0 |
0 |
0.000000 |
0.000000 |
0.000000 |
0.000000 |
0.000000 |
| PIERS0036 |
Prairie View A&M University |
90/96 |
11.120000 |
-62.800000 |
0 |
0 |
0.000000 |
0.000000 |
0.000000 |
0.000000 |
0.000000 |
| PIERS0037 |
INCUS experiment - Fort Collins, CO |
40/96 |
12.310000 |
-97.200000 |
0 |
0 |
0.000000 |
0.000000 |
0.000000 |
0.000000 |
0.000000 |
| PIERS0038 |
Hampton University - CBBT, Island Three |
90/96 |
12.840000 |
-75.360000 |
274 |
287 |
2.740000 |
69.600000 |
2.870000 |
72.900000 |
-4.740000 |
| PIERS0039 |
NPOL Radar |
90/96 |
13.070000 |
-90.560000 |
304 |
310 |
3.040000 |
77.220000 |
3.100000 |
78.740000 |
-1.970000 |
| PIERS0040 |
Redden Farm |
90/96 |
13.220000 |
-94.800000 |
175 |
174 |
1.750000 |
44.450000 |
1.740000 |
44.200000 |
0.570000 |
| PIERS0041 |
GSFC/Greenbelt - B33 Rooftop |
90/96 |
12.710000 |
-78.930000 |
59 |
53 |
0.590000 |
14.990000 |
0.530000 |
13.460000 |
10.170000 |
| PIERS0042 |
WFF Pad |
90/96 |
12.490000 |
-85.360000 |
129 |
140 |
1.290000 |
32.770000 |
1.400000 |
35.560000 |
-8.530000 |
Documentation
|