NMQ: National Mosaic and Multi-Sensor QPE
Comparisons of rainrates from gauges and NMQ over South Fork Basin, IA
Gauge data
A network of 5 indvidual gauge platforms (two tipping-bucket gauges A & B per platform) was deployed
over South Fork Basin, Iowa.
Here is a list of these platforms and their locations as well as their deployment dates.
 Site               Lat(N)         Lon(W)    Deployment date
NASA0046          42.304850	-93.483616     Mar 7, 2014
NASA0047	  42.398868	-93.444281     Mar 7, 2014
NASA0048	  42.297846	-93.520643     Mar 7, 2014
NASA0049	  42.637269	-93.341192     Apr 5, 2014
NASA0050	  42.451260	-93.232442     Apr 5, 2014
Though NASA0046-48 were deployed on Mar 7, 2014, these 6 gauges started to report rain tips from late Mar 16, 2014
most likely due to ice in the gauge buckets.
All these gauges measure rainfall in increments of 0.01 inch (0.254 mm). A/B gauges Comparisons
Comparisons with NMQ at various scales
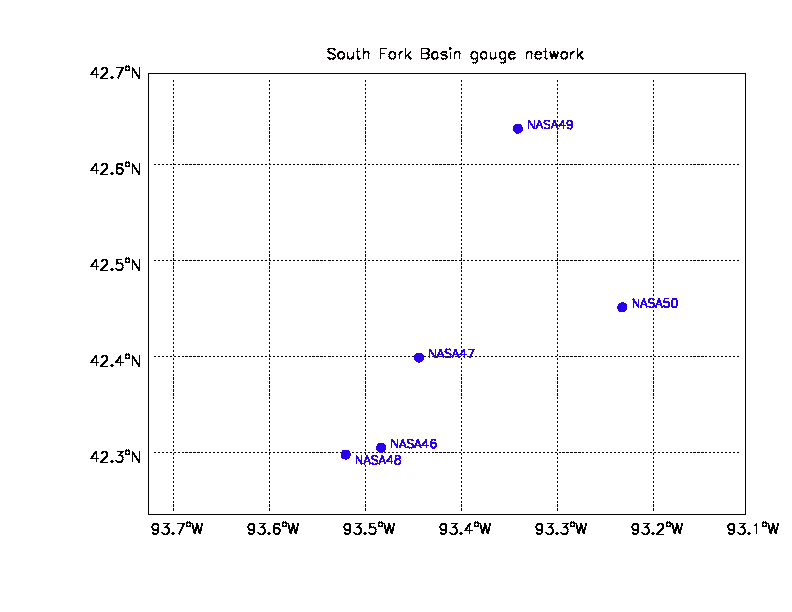
The following figure shows the areal map of South Fork gauge networks along with 0.1o
grids. The dots denote locations of the individual gauge platforms with their identification
numbers indicated on the right.
The gauge tip data are averaged over the entire network,
and compared with the average NMQ rainrates over the area [93.11 W->93.72 W, 42.24N->42.69N]
at hourly, 3-hourly and daily resolutions.
Since the gauges started to report rain tips from late Mar 16, 2014, both the NMQ and gauge data
from 17 Mar 2014 are included in following comparisons.
- Cumulative rainfall
- Scatter plot
- Mean difference and relative error
- PDF by occurrence and volume
In the PDF plot, rainrate thresholds are set to 0.1, 0.2 and 0.5 mm/h.
The inserted "Agreement" in the PDF plot is defined as the fraction of both NMQ and gauge report
the same rain category: rain ( rainrate >threshold), no rain (rainrate <=threshold) among all available
observations.
Agreement=N[(r>T & g>T) + (r<=T & g<=T)] / N(r>=T & g>=T)
where T is rain threshold (0.1,0.2 0r 0.5 mm/h),
N is sample size, r is NMQ rainrate, and g is gauge rainrate.
Be definition, Agreement is between 0 (worst) and 1 (best).
|