|


|
Comparisons of rainrates from gauges and MRMS over Pocomoke, MD
Gauge data
A network of 25 individual gauge platforms (two tipping-bucket gauges per platform) was deployed near Nassawadox, VA area from Apr 2012 to Sep 2013. Now that the NPOL radar has been deployed in the Newark, MD area, the gauge network has been moved to the Pocomoke (PCMK) area. Gauges are moved in and out of this area, As of 11/29/2022, there are 24 active gauges (12 platforms) in PCMK.Collocated gauge comparisons
Note:
The time series for "all gauges" in Pocomoke network is plotted for daily rainfall only. Gauge data from 21 Sep 2015 to 27 Oct 2015 are missing for most gauges due to a server hack. There is no reliable gauge data from 11/16/2017 to 01/26/2018 due to a server issue with U. Iowa.
Comparisons with MRMS at various scales
The following figure shows an example of the areal map of Pocomoke gauge network along with 0.01o MRMS grids. The dots denote locations of the individual gauge platforms with their identification numbers indicated on the right. Again, the gauges in the network could be moved in or out.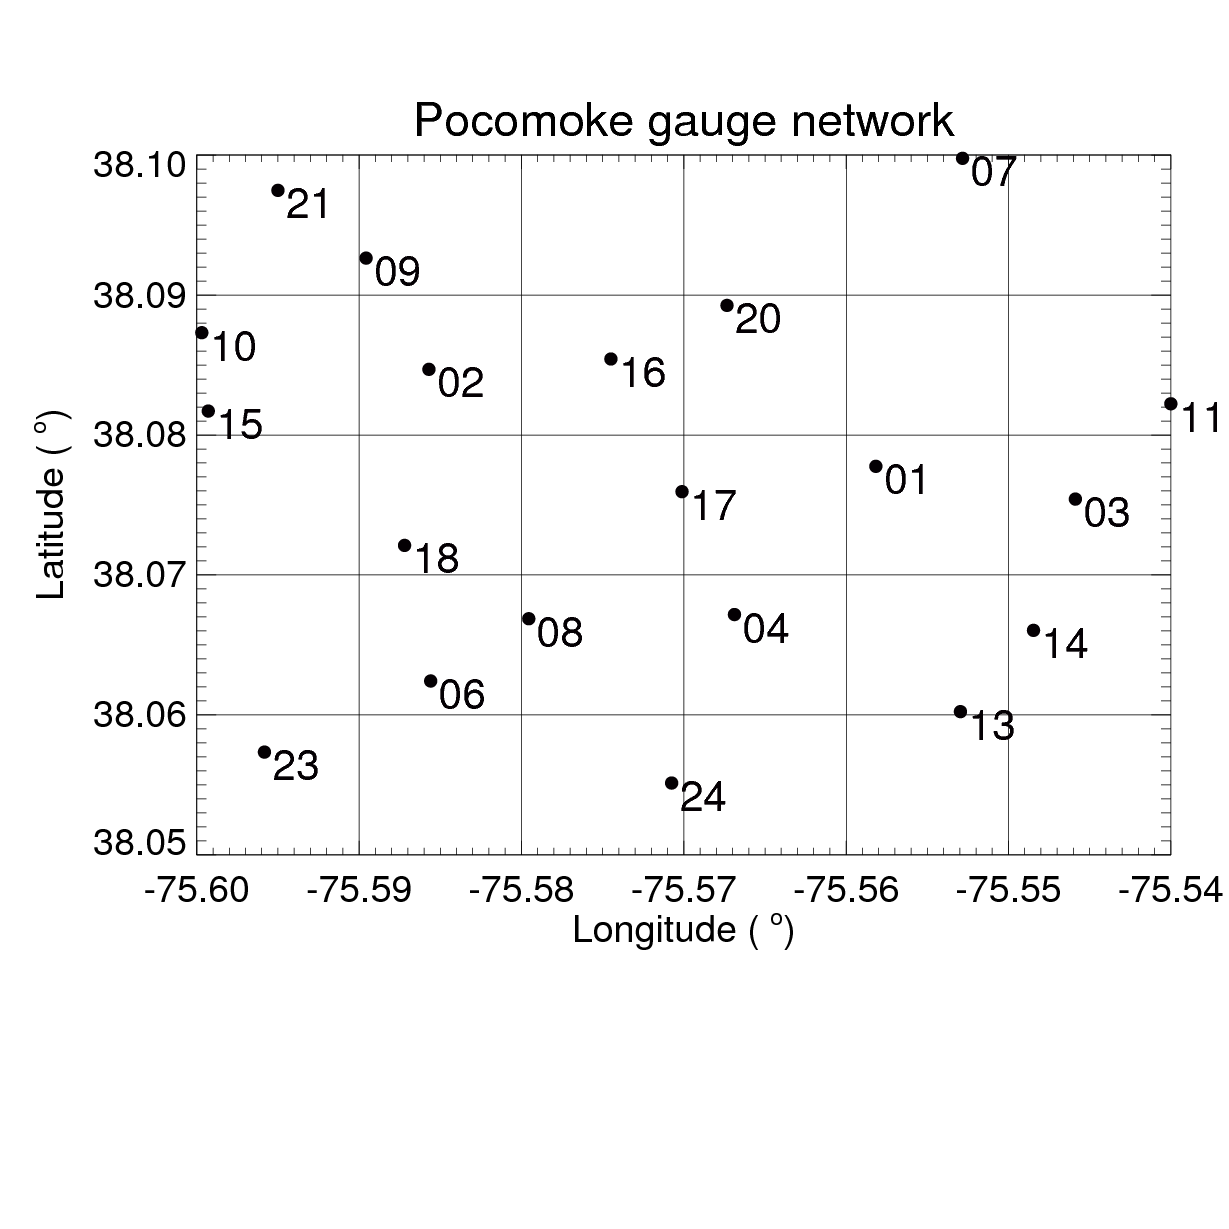
All these gauges measure rainfall in increments of 0.01 inch (0.254 mm).
The rain tip data from each gauge are quality-controlled, and then compared with the MRMS rainrates at each 0.01-degree pixel where the gauge locates. The comparisons are conducted at hourly and daily resolutions for each matched pixel, as well as for averaged pixel from all matched data. Note:
The MRMS and gauge data from Jun 2014 to Nov 16, 2022 as of this update, except for a lot of missing data, are included in this study.
Following MRMS data are missing:
8-15 Sep 2015; 9-10, 23-31 Oct, 2015; 22-23 Nov 2015; 01 Jan-07 Jun 2016; 01 Sep-23 Sep 2016; 17 Sep-30 Nov 2017;
27 Jul 2022 - 25 Aug 2022; and several other periods
- Cumulative rainfall
MRMS: no gauge-corrected, no QC
MRMS_GC: gauge-corrected
MRMS_QC: gauge corrected and QCed with following filters:
rqi>=0.8, liquid precipitation only, 0.5<=ratio<=2 and ratio=0 - Scatter plot
- Mean difference and relative error
- PDF by occurrence and volume
In the PDF plot, rainrate thresholds are set to 0.1, 0.2 and 0.5 mm/h, which are close to ground radar, GPM DPR and TRMM PR minimum detectable rainrates. The inserted "Agreement" in the PDF plot is defined as the fraction of both MRMS and gauge report the same rain category: rain ( rainrate >threshold), no rain (rainrate <=threshold) among all available observations. Agreement=N[(r>T & g>T) + (r<=T & g<=T)] / N(r>=T & g>=T)
where T is rain threshold (0.1,0.2 0r 0.5 mm/h), N is sample size, r is MRMS rainrate, and g is gauge rainrate. Be definition, Agreement is between 0 (worst) and 1 (best).

|
Privacy Policy and Important Notices |
|
Web Curator: jianxin.wang@nasa.gov NASA Official: David B. Wolff |