MRMS/HalfDegGauge
Comparisons of rainrates from gauges and MRMS over HalfDeg Gauge Network, MD-VA
Gauge data
A network of 21 individual gauge sites was deployed
in an approximately 0.5-degree grid area over Delmarva Peninsula near Maryland-Virgina boundary.
Three tipping-bucket gauges were equipped at each of Sites 01-09,18,19,29,30 and two at each of Sites 10-17.
Here is a list of these gauge sites and their locations as well as their deployment dates.
SiteID         Lat(N)        Lon(W)       Installation Date
0001         38.03231      75.39695   Fri, 21 February 2014
0002         38.33289      75.70567   Wed, 26 February 2014
0003         38.19720      75.69918   Thu, 29 December 2011
0004         38.16560      75.39945   Thu, 05 January 2012
0005         37.93716      75.46634   Fri, 20 August 2004 (Gauges A&B),Gauge C was installed on Fri, 30 May 2008
0006         37.92781      75.72054   Fri, 16 December 2011
0007         38.01686      75.82676   Thu, 22 December 2011
0008         38.34092      75.51331   Tue, 24 August 2004 (Gauges A&B),Gauge C was installen on Tue, 03 June 2008
0009         38.19685      75.36974   Mon, 24 March 2014, In addition,
              NASA38 (A&B) was moved to Site09 on 06 May 2015. So, 5 gauges at Site09.
0010         38.36982      75.65482   Wed, 04 Jun  2014 (NASA0012)
0011         38.01403      75.52278   Mon, 21 July 2014 (NASA0019)
0012         38.26268      75.34166   Thu, 21 Aug  2014 (NASA0025),moved from (37.93456  -75.47101) on 21 Aug 2014,
               then moved to Site0016 (38.05473, -75.40990) on 2015-Apr-14
0013         38.33173      75.40291   Thu, 16 Oct  2014 (NASA0022)
0014         38.12071      75.73399   Thu, 05 Feb  2015 (NASA0005)
0015	     38.012383     75.455125  Mon, 09 Mar  2015 (NASA0017)
0016	     38.054728     75.409900  Tue, 14 Apr  2015 (NASA0025)
0017	     38.36986      75.31886   Mon, 08 Jun  2015 (NASA0006)
0018         38.09558      75.43140   Thu, 11 Feb  2016
0019         38.21044      75.58657   Wed, 09 Mar  2016
0029         37.97574      75.50856   Wed, 25 Aug  2016
0030         37.88065      75.43800   Tue, 05 Jan  2016, data valid after Thu, 23 Feb 2017
All these gauges measure rainfall in increments of 0.01 inch (0.254 mm).
Collocated gauge comparisons
Comparisons with MRMS
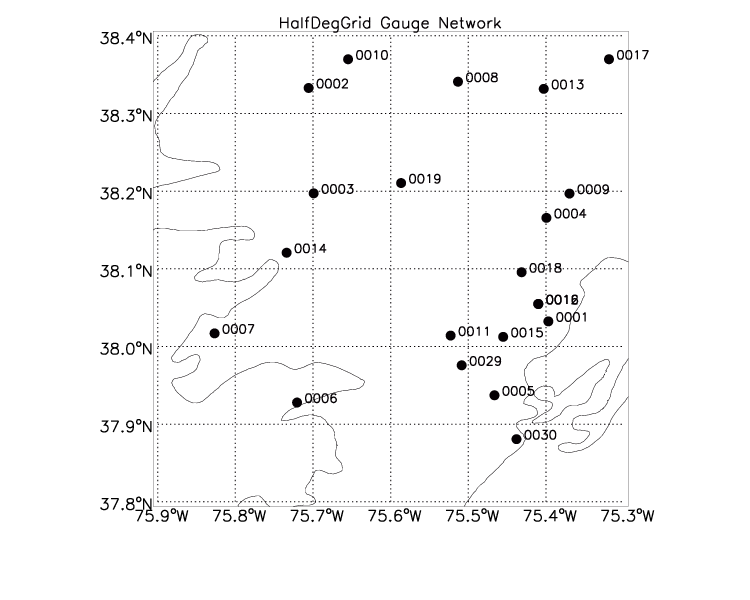
The following figure shows the areal map of HalfDegGrid Gauge Networks along with 0.1o
grids. The dots denote locations of the individual gauge sites with their identification
numbers indicated on the right.
 The rain tip data from each gauge are QCed, and compared with the
MRMS rainrates at each 0.01-degree pixel where the gauge
locates. The comparisons are conducted at hourly and daily
resolutions for each matched pixel, as well as for averaged pixel
from all matched data.
Two sets of MRMS files, hourly and half-hourly are available for
this study. Hourly MRMS files are available from 01 Feb 2013 to
06 Jun 2016, and half-hourly files from 01 Jun 2014 to present
with a lof of missings (eg. Jan 01 - Jun 07, 2016; Sep 01-23, 2016
and many other periods).
The rain tip data from each gauge are QCed, and compared with the
MRMS rainrates at each 0.01-degree pixel where the gauge
locates. The comparisons are conducted at hourly and daily
resolutions for each matched pixel, as well as for averaged pixel
from all matched data.
Two sets of MRMS files, hourly and half-hourly are available for
this study. Hourly MRMS files are available from 01 Feb 2013 to
06 Jun 2016, and half-hourly files from 01 Jun 2014 to present
with a lof of missings (eg. Jan 01 - Jun 07, 2016; Sep 01-23, 2016
and many other periods).
Below is the comparison using hourly MRMS data (Mar 2014 - Dec 2015)
- Scatter plot
- Mean difference and relative error
- PDF by occurrence and volume
In the PDF plot, rainrate thresholds are set to 0.1, 0.2 and 0.5 mm/h.
The inserted "Agreement" in the PDF plot is defined as the fraction of both MRMS and gauge report
the same rain category: rain ( rainrate >threshold), no rain (rainrate <=threshold) among all available
observations.
Agreement=N[(r>T & g>T) + (r<=T & g<=T)] / N(r>=T & g>=T)
where T is rain threshold (0.1,0.2 0r 0.5 mm/h),
N is sample size, r is MRMS rainrate, and g is gauge rainrate.
Be definition, Agreement is between 0 (worst) and 1 (best).
Below is the comparison using QCed half-hourly MRMS files (Jun
2014 - Aug 2019)
The half-hourly MRMS data are QCed using following filters, and then
accumulated to hourly and daily rainrates.
RQI>=80; 0.5<=ratio<=2. and ratio=0.; liquid precipitation only
- Cumulative rainfall
- Scatter plot
- Mean difference and relative error
- PDF by occurrence and volume
|